- Page 1:
2012 COMMISSION O N T H E REFORM O
- Page 4 and 5:
For electronic copies of this docum
- Page 6 and 7:
Chapter 4: Making Transformation Wo
- Page 8 and 9:
Chapter 9: Employment and Training
- Page 10 and 11:
Chapter 18: Revenue Integrity Incre
- Page 12 and 13:
This context lifts the task ahead w
- Page 14 and 15:
Action must begin very soon. The de
- Page 16 and 17:
xii Dominic Giroux, Commiss
- Page 18 and 19:
Photo Credit: Jovan Matic xiv Carol
- Page 20 and 21:
First, we assessed the 2011 Budget
- Page 22 and 23:
How did we get to this point? For m
- Page 24 and 25:
6 TABLE 1. Three Views of the Outlo
- Page 26 and 27:
This permits post-secondary educati
- Page 28 and 29:
How does our scenario for the perio
- Page 30 and 31:
The “don’ts” are proposals th
- Page 32 and 33:
Several measures would strengthen t
- Page 34 and 35:
Health care is the Ontario governme
- Page 36 and 37:
There are inefficiencies in the hea
- Page 38 and 39:
20 Service Delivery � Mostly publ
- Page 40 and 41:
Our first recommendation is that th
- Page 42 and 43:
Evidence should drive policy. Medic
- Page 44 and 45:
One potential way to reduce overall
- Page 46 and 47:
Elementary and Secondary Education
- Page 48 and 49:
Non-Teaching Staff: Since 2002-03,
- Page 50 and 51:
Delivering Services More Efficientl
- Page 52 and 53:
Simply maintaining the status quo r
- Page 54 and 55:
� Mandate agreements should inclu
- Page 56 and 57:
Benefit programs are delivered thro
- Page 58 and 59:
Child Welfare: In this case, as wit
- Page 60 and 61:
With so many services provided by s
- Page 62 and 63:
Over the past decade, the Ontario g
- Page 64 and 65:
Urban transportation is a particula
- Page 66 and 67:
Environment and Natural Resources R
- Page 68 and 69:
� Aging infrastructure is deterio
- Page 70 and 71:
Labour Relations and Compensation T
- Page 72 and 73:
Leaders in the OPS and BPS should b
- Page 74 and 75:
In a number of areas, efficiencies
- Page 76 and 77:
Revenue Integrity Across a range of
- Page 78 and 79:
Contraband tobacco is another issue
- Page 80 and 81:
Risks Posed by the Federal Governme
- Page 82 and 83:
� Long-term health costs outstrip
- Page 84 and 85:
Immigration settlement and integrat
- Page 87 and 88:
Chapter 1: The Need for Strong Fisc
- Page 89 and 90:
The Budget Scenario Chapter 1: The
- Page 91 and 92:
Chapter 1: The Need for Strong Fisc
- Page 93 and 94:
Chapter 1: The Need for Strong Fisc
- Page 95 and 96:
Chapter 1: The Need for Strong Fisc
- Page 97 and 98:
Chapter 1: The Need for Strong Fisc
- Page 99 and 100:
Chapter 1: The Need for Strong Fisc
- Page 101 and 102:
80 60 40 20 0 Rest of Canada Ontari
- Page 103 and 104:
Chapter 1: The Need for Strong Fisc
- Page 105 and 106:
Chapter 1: The Need for Strong Fisc
- Page 107 and 108:
Chapter 1: The Need for Strong Fisc
- Page 109 and 110:
Revenue Implications Chapter 1: The
- Page 111 and 112:
Chapter 1: The Need for Strong Fisc
- Page 113 and 114:
Chapter 1: The Need for Strong Fisc
- Page 115 and 116:
Chapter 1: The Need for Strong Fisc
- Page 117 and 118:
Chapter 1: The Need for Strong Fisc
- Page 119 and 120:
TABLE 1.1 Three Views of the Outloo
- Page 121 and 122:
Chapter 1: The Need for Strong Fisc
- Page 123 and 124:
Chapter 1: The Need for Strong Fisc
- Page 125 and 126:
Conclusion Chapter 1: The Need for
- Page 127 and 128:
Chapter 2: The Fiscal Challenge in
- Page 129 and 130:
Chapter 2: The Fiscal Challenge in
- Page 131 and 132:
Chapter 2: The Fiscal Challenge in
- Page 133 and 134:
Chapter 2: The Fiscal Challenge in
- Page 135 and 136:
Chapter 2: The Fiscal Challenge in
- Page 137 and 138:
Chapter 2: The Fiscal Challenge in
- Page 139 and 140:
The Challenge Chapter 2: The Fiscal
- Page 141 and 142:
Chapter 3: Our Mandate and Approach
- Page 143 and 144:
Chapter 3: Our Mandate and Approach
- Page 145 and 146:
Chapter 3: Our Mandate and Approach
- Page 147 and 148:
Chapter 3: Our Mandate and Approach
- Page 149 and 150:
Chapter 3: Our Mandate and Approach
- Page 151 and 152:
Chapter 3: Our Mandate and Approach
- Page 153 and 154:
Chapter 4: Making Transformation Wo
- Page 155 and 156:
Chapter 4: Making Transformation Wo
- Page 157 and 158:
Chapter 4: Making Transformation Wo
- Page 159 and 160:
Chapter 4: Making Transformation Wo
- Page 161 and 162:
Chapter 5: Health Chapter 5: Health
- Page 163 and 164:
Chapter 5: Health Indeed, quality a
- Page 165 and 166:
The Cost: Now and Ahead Chapter 5:
- Page 167 and 168:
Is the Health Care System Sustainab
- Page 169 and 170:
Chapter 5: Health In Ontario, a few
- Page 171 and 172:
Chapter 5: Health Case Study #1: A
- Page 173 and 174:
Chapter 5: Health Canada’s health
- Page 175 and 176:
Canada falls short on many measures
- Page 177 and 178:
There are inefficiencies in the hea
- Page 179 and 180:
Chapter 5: Health A broader perspec
- Page 181 and 182:
Chapter 5: Health However, this is
- Page 183 and 184:
Mental health and addiction issues
- Page 185 and 186:
Chapter 5: Health Today, however, t
- Page 187 and 188:
Service Delivery Chapter 5: Health
- Page 189 and 190:
Chapter 5: Health Medical schools p
- Page 191 and 192:
Chapter 5: Health There is much to
- Page 193 and 194:
Recommendation 5-2: Evaluate all pr
- Page 195 and 196:
Chapter 5: Health Several key princ
- Page 197 and 198:
Chapter 5: Health There are more th
- Page 199 and 200:
Optimize Human Resources Capacity C
- Page 201 and 202:
Chapter 5: Health The LHINs should
- Page 203 and 204:
Chapter 5: Health Recommendation 5-
- Page 205 and 206:
Chapter 5: Health Despite variation
- Page 207 and 208:
Chapter 5: Health Recommendation 5-
- Page 209 and 210:
Chapter 5: Health The ministry shou
- Page 211 and 212:
Chapter 5: Health � An “assess
- Page 213 and 214:
Chapter 5: Health Recommendation 5-
- Page 215 and 216:
Chapter 5: Health The Commi
- Page 217 and 218:
Cost Efficiencies Chapter 5: Health
- Page 219 and 220:
Chapter 5: Health The stakeholders
- Page 221 and 222:
Chapter 6: Elementary and Secondary
- Page 223 and 224:
Chapter 6: Elementary and Secondary
- Page 225 and 226:
Chapter 6: Elementary and Secondary
- Page 227 and 228:
Chapter 6: Elementary and Secondary
- Page 229 and 230:
Chapter 6: Elementary and Secondary
- Page 231 and 232:
Affordability of the Full-Day Kinde
- Page 233 and 234:
Class Sizes Chapter 6: Elementary a
- Page 235 and 236:
Chapter 6: Elementary and Secondary
- Page 237 and 238:
Chapter 6: Elementary and Secondary
- Page 239 and 240:
Chapter 6: Elementary and Secondary
- Page 241 and 242:
Chapter 6: Elementary and Secondary
- Page 243 and 244:
Chapter 6: Elementary and Secondary
- Page 245 and 246:
Reform of Provincial Schools Chapte
- Page 247 and 248:
Chapter 6: Elementary and Secondary
- Page 249 and 250:
Chapter 6: Elementary and Secondary
- Page 251 and 252:
Chapter 6: Elementary and Secondary
- Page 253 and 254:
Chapter 6: Elementary and Secondary
- Page 255 and 256:
Chapter 6: Elementary and Secondary
- Page 257 and 258:
Chapter 7: Post-Secondary Education
- Page 259 and 260: Need for Clear Objectives Chapter 7
- Page 261 and 262: Chapter 7: Post-Secondary Education
- Page 263 and 264: 9,000 8,000 7,000 6,000 5,000 Unive
- Page 265 and 266: Chapter 7: Post-Secondary Education
- Page 267 and 268: Chapter 7: Post-Secondary Education
- Page 269 and 270: Chapter 7: Post-Secondary Education
- Page 271 and 272: Chapter 7: Post-Secondary Education
- Page 273 and 274: Chapter 7: Post-Secondary Education
- Page 275 and 276: Chapter 7: Post-Secondary Education
- Page 277 and 278: Chapter 8: Social Programs Chapter
- Page 279 and 280: The Challenge Chapter 8: Social Pro
- Page 281 and 282: Chapter 8: Social Programs Recommen
- Page 283 and 284: Chapter 8: Social Programs In the a
- Page 285 and 286: Initial Assessment Chapter 8: Socia
- Page 287 and 288: Chapter 8: Social Programs To quali
- Page 289 and 290: Chapter 8: Social Programs While th
- Page 291 and 292: Youth Justice Chapter 8: Social Pro
- Page 293 and 294: General Approach � Transaction fo
- Page 295 and 296: Chapter 9: Employment and Training
- Page 297 and 298: Employment and Training Services Pr
- Page 299 and 300: Chapter 9: Employment and Training
- Page 301 and 302: Chapter 9: Employment and Training
- Page 303 and 304: Chapter 9: Employment and Training
- Page 305 and 306: Chapter 10: Immigration The Economi
- Page 307 and 308: TABLE 10.1 Permanent Residents Admi
- Page 309: Chapter 10: Immigration Recommendat
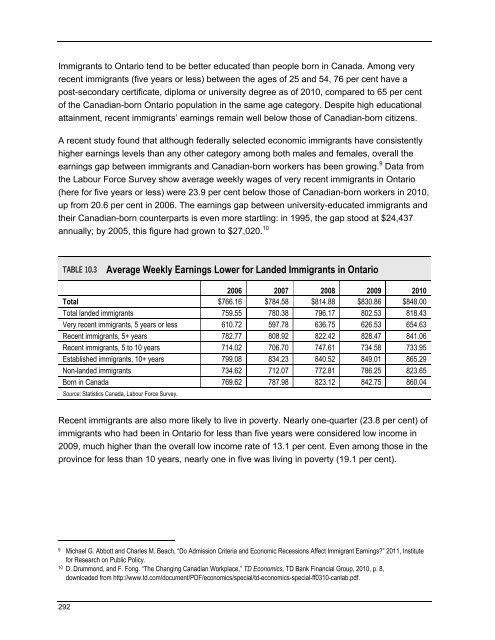
- Page 313 and 314: TABLE 10.4 Integration Program Fund
- Page 315 and 316: Chapter 10: Immigration A new COIA
- Page 317 and 318: Chapter 11: Business Support Chapte
- Page 319 and 320: � Investment in post-secondary ed
- Page 321 and 322: TABLE 11.1 Total Business Tax Relie
- Page 323 and 324: Types of Business Support Chapter 1
- Page 325 and 326: Chapter 11: Business Support The pr
- Page 327 and 328: Chapter 11: Business Support An Ill
- Page 329 and 330: Chapter 11: Business Support The pr
- Page 331 and 332: Chapter 11: Business Support To fun
- Page 333 and 334: Chapter 11: Business Support Tax ex
- Page 335 and 336: Chapter 11: Business Support For ex
- Page 337 and 338: Appendix 11.1 List of Business Supp
- Page 339 and 340: Chapter 12: Infrastructure, Real Es
- Page 341 and 342: Transportation Chapter 12: Infrastr
- Page 343 and 344: Chapter 12: Infrastructure, Real Es
- Page 345 and 346: Chapter 12: Infrastructure, Real Es
- Page 347 and 348: Chapter 12: Infrastructure, Real Es
- Page 349 and 350: Chapter 12: Infrastructure, Real Es
- Page 351 and 352: Chapter 12: Infrastructure, Real Es
- Page 353 and 354: Chapter 13: Environment and Natural
- Page 355 and 356: Chapter 13: Environment and Natural
- Page 357 and 358: Reform the approvals process Chapte
- Page 359 and 360: Chapter 13: Environment and Natural
- Page 361 and 362:
Chapter 13: Environment and Natural
- Page 363 and 364:
Ring of Fire Chapter 13: Environmen
- Page 365 and 366:
Chapter 14: Justice Sector 2010-11
- Page 367 and 368:
Recent Expenditures Chapter 14: Jus
- Page 369 and 370:
Chapter 14: Justice Sector Public E
- Page 371 and 372:
Chapter 14: Justice Sector Continuo
- Page 373 and 374:
Chapter 14: Justice Sector Building
- Page 375 and 376:
Efficiencies Clustering OPS Adjudic
- Page 377 and 378:
Chapter 14: Justice Sector Analysis
- Page 379 and 380:
Chapter 14: Justice Sector Recommen
- Page 381 and 382:
Chapter 15: Labour Relations and Co
- Page 383 and 384:
Chapter 15: Labour Relations and Co
- Page 385 and 386:
Chapter 15: Labour Relations and Co
- Page 387 and 388:
A Balanced, Effective and Transpare
- Page 389 and 390:
Chapter 15: Labour Relations and Co
- Page 391 and 392:
Chapter 15: Labour Relations and Co
- Page 393 and 394:
Chapter 15: Labour Relations and Co
- Page 395 and 396:
Chapter 15: Labour Relations and Co
- Page 397 and 398:
Chapter 15: Labour Relations and Co
- Page 399 and 400:
Chapter 15: Labour Relations and Co
- Page 401 and 402:
Chapter 16: Operating and Back-Offi
- Page 403 and 404:
Chapter 16: Operating and Back-Offi
- Page 405 and 406:
ServiceOntario Transformation Chapt
- Page 407 and 408:
Chapter 16: Operating and Back-Offi
- Page 409 and 410:
Chapter 16: Operating and Back-Offi
- Page 411 and 412:
Chapter 16: Operating and Back-Offi
- Page 413 and 414:
Chapter 16: Operating and Back-Offi
- Page 415 and 416:
I&IT Transformation Chapter 16: Ope
- Page 417 and 418:
Back-Office Consolidation Chapter 1
- Page 419 and 420:
Chapter 16: Operating and Back-Offi
- Page 421 and 422:
Chapter 17: Government Business Ent
- Page 423 and 424:
Chapter 17: Government Business Ent
- Page 425 and 426:
Chapter 17: Government Business Ent
- Page 427 and 428:
Chapter 17: Government Business Ent
- Page 429 and 430:
Chapter 18: Revenue Integrity Chapt
- Page 431 and 432:
Chapter 18: Revenue Integrity Stati
- Page 433 and 434:
Uncollected Fines Chapter 18: Reven
- Page 435 and 436:
Chapter 18: Revenue Integrity The M
- Page 437 and 438:
Tax Revenue Chapter 18: Revenue Int
- Page 439 and 440:
CHART 18.2 Assessment and Tax Growt
- Page 441 and 442:
Chapter 18: Revenue Integrity The c
- Page 443 and 444:
Chapter 18: Revenue Integrity The t
- Page 445 and 446:
Chapter 18: Revenue Integrity Appen
- Page 447 and 448:
Chapter 19: Liability Management In
- Page 449 and 450:
Chapter 19: Liability Management To
- Page 451 and 452:
Chapter 19: Liability Management Th
- Page 453 and 454:
Chapter 19: Liability Management Bo
- Page 455 and 456:
TABLE 19.2 Historical and Projected
- Page 457 and 458:
Chapter 19: Liability Management Re
- Page 459 and 460:
Chapter 19: Liability Management Re
- Page 461 and 462:
Social Housing Chapter 19: Liabilit
- Page 463 and 464:
Chapter 19: Liability Management Fo
- Page 465 and 466:
Chapter 19: Liability Management Fo
- Page 467 and 468:
Chapter 20: Intergovernmental Relat
- Page 469 and 470:
CHART 20.1 Ontario’s Share of Fed
- Page 471 and 472:
CHART 20.3 Ontario’s Fiscal Gap 1
- Page 473 and 474:
Chapter 20: Intergovernmental Relat
- Page 475 and 476:
Potential Federal Impacts on Ontari
- Page 477 and 478:
Long-Term Health Costs Likely Outpa
- Page 479 and 480:
TABLE 20.2 Selected Examples of Tra
- Page 481 and 482:
CHART 20.7 2011-12 Equalization Ent
- Page 483 and 484:
Canada Social Transfer Chapter 20:
- Page 485 and 486:
Chart 20.10 Employment Outcomes for
- Page 487 and 488:
Green Energy Chapter 20: Intergover
- Page 489 and 490:
Chapter 20: Intergovernmental Relat
- Page 491 and 492:
Chapter 20: Intergovernmental Relat
- Page 493 and 494:
Environmental Protection and Regula
- Page 495 and 496:
CHART 20.11 2009 Municipal Revenues
- Page 497 and 498:
Infrastructure, Real Estate and Ele
- Page 499 and 500:
Chapter 20: Intergovernmental Relat
- Page 501 and 502:
Chapter 20: Intergovernmental Relat
- Page 503 and 504:
Chapter 20: Intergovernmental Relat
- Page 505 and 506:
Appendix 1: Commission</str
- Page 507 and 508:
Chapter 1: The Need for Strong Fisc
- Page 509 and 510:
Appendix: Commission</stron
- Page 511 and 512:
Appendix: Commission</stron
- Page 513 and 514:
Appendix: Commission</stron
- Page 515 and 516:
Appendix: Commission</stron
- Page 517 and 518:
Appendix: Commission</stron
- Page 519 and 520:
Appendix: Commission</stron
- Page 521 and 522:
Appendix: Commission</stron
- Page 523 and 524:
Appendix: Commission</stron
- Page 525 and 526:
Appendix: Commission</stron
- Page 527 and 528:
Appendix: Commission</stron
- Page 529 and 530:
Chapter 7: Post-Secondary Education
- Page 531 and 532:
Appendix: Commission</stron
- Page 533 and 534:
Recommendation 8-9: Advocate for fe
- Page 535 and 536:
Chapter 9: Employment and Training
- Page 537 and 538:
Chapter 11: Business Support Append
- Page 539 and 540:
Chapter 12: Infrastructure, Real Es
- Page 541 and 542:
Chapter 13: Environment and Natural
- Page 543 and 544:
Chapter 15: Labour Relations and Co
- Page 545 and 546:
Chapter 16: Operating and Back-Offi
- Page 547 and 548:
Chapter 17: Government Business Ent
- Page 549 and 550:
Chapter 18: Revenue Integrity Appen
- Page 551 and 552:
Appendix: Commission</stron
- Page 553 and 554:
Appendix: Commission</stron
- Page 555 and 556:
Appendix 2: List of Acronyms ABCs a
- Page 557 and 558:
FIT feed-in tariff FSCO Financial S
- Page 559 and 560:
MTCU Ministry of Training, Colleges
- Page 561 and 562:
REA Renewable Energy Approval RFP r


![Demande d'inscription en vertu de l'IFTA - IFTA 401 [ PDF - 795 KO ]](https://img.yumpu.com/15864716/1/190x245/demande-dinscription-en-vertu-de-lifta-ifta-401-pdf-795-ko-.jpg?quality=85)
