2. análisis de la situación actual de la red viaria - Garraioak
2. análisis de la situación actual de la red viaria - Garraioak
2. análisis de la situación actual de la red viaria - Garraioak

You also want an ePaper? Increase the reach of your titles
YUMPU automatically turns print PDFs into web optimized ePapers that Google loves.
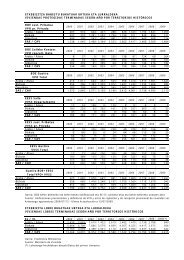
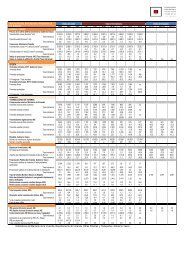
IMD<br />
AUTOPISTAS, AUTOVÍAS Y CARRETERAS DESDOBLADAS: VALORES DE P Y N<br />
IMD<br />
Red <strong>de</strong> Interés Preferente Red Básica<br />
P N P N<br />
0 – 5.000 292,62 1,18 - -<br />
5.001 – 10.000 57,08 1,13 130,27 4,28<br />
10.001 - 15.000 102,16 4,60 12,01 0,64<br />
15.001 - 20.000 88,28 5,47 51,35 2,94<br />
20.001 - 30.000 151,77 14,10 44,73 3,28<br />
30.001 - 40.000 36,08 4,78 99,30 9,24<br />
> 40.000 58,07 18,07 64,10 20,26<br />
Fuente: E<strong>la</strong>boración propia.<br />
CARRETERAS CONVENCIONALES: VALORES DE P Y N<br />
Red <strong>de</strong> Interés Preferente Red Básica Red Comarcal<br />
P N P N P P<br />
0 - 1.000 - - - - 112,85 0,31<br />
1.001 - 3.000 141,84 1,28 229,19 1,88 76,60 0,59<br />
3001 - 6.000 187,74 2,87 81,23 1,32 84,40 1,25<br />
6.001 - 8.000 100,30 2,51 124,58 3,18 108,48 2,89<br />
8.001 - 10.000 165,08 5,37 80,41 2,73 73,53 2,37<br />
10.001 - 1<strong>2.</strong>000 89,55 3,37 47,32 1,94 60,01 2,45<br />
1<strong>2.</strong>001 - 15.000 166,14 8,46 77,72 3,86 77,58 3,60<br />
> 15.000 74,18 6,85 94,01 6,31 38,25 3,83<br />
Fuente: E<strong>la</strong>boración propia.<br />
I<strong>de</strong>ntificación <strong>de</strong> TCA<br />
La aplicación <strong>de</strong> los criterios que se acaban <strong>de</strong> citar a los 350 posibles Tramos <strong>de</strong> Concentración <strong>de</strong><br />
Acci<strong>de</strong>ntes da como resultado que sean 89 los tramos que cumplen los requisitos establecidos y pasen a<br />
tener <strong>la</strong> <strong>de</strong>nominación <strong>de</strong> TCA. Estos 89 tramos, se reparten por <strong>la</strong>s carreteras <strong>de</strong> <strong>la</strong> Red Funcional <strong>de</strong> <strong>la</strong><br />
siguiente manera:<br />
Tipo <strong>de</strong> vía<br />
DISTRIBUCIÓN DE LOS TCA EN LA RED FUNCIONAL<br />
Red <strong>de</strong> Interés<br />
Preferente<br />
Red Básica Red Comarcal<br />
Autopistas 6 0 -<br />
Autovías y Vías <strong>de</strong> Doble Calzada 10 2 -<br />
Calzada Única 11 33 26<br />
Total 28 35 26<br />
Fuente: E<strong>la</strong>boración propia.<br />
Los TCA, no se distribuyen homogéneamente por los diferentes rangos <strong>de</strong> IMD, tal y como se observa en <strong>la</strong><br />
tab<strong>la</strong> y gráficos adjuntos:<br />
DISTRIBUCIÓN DE TCA POR RANGOS DE IMD EN AUTOPISTAS, AUTOVÍAS Y VÍAS DE DOBLE<br />
CALZADA<br />
IMD<br />
Autopistas Autovías y Vías <strong>de</strong> Doble Calzada<br />
Red Preferente Red Básica Red Preferente Red Básica<br />
0 - 5.000 1 0 0 0<br />
5.001 - 10.000 0 0 0 1<br />
10.001 - 15.000 0 0 1 1<br />
15.001 - 20.000 0 0 0 0<br />
20.001 - 30.000 0 0 0 0<br />
30.001 - 40.000 1 0 6 0<br />
> 40.000 4 0 3 0<br />
Fuente: E<strong>la</strong>boración propia.<br />
110<br />
Revisión <strong>de</strong>l Segundo P<strong>la</strong>n General <strong>de</strong> Carreteras <strong>de</strong>l País Vasco