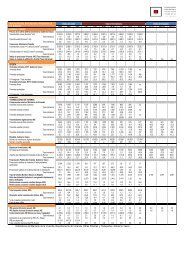
Estación Carretera Tipo P.K. Localidad más próxima IMD 2003 2002 2001 2000 1999 1998 1997 % Pesados IMD % Pesados IMD % Pesados IMD % Pesados IMD % Pesados IMD % Pesados IMD % Pesados 162 Variación (%) 1997 - 2003 IMD Pesados 1071 A-625 1 369,0 Llodio (Amurrio) 11.222 8,1 11.773 10,2 9.822 19,9 8.725 29,1 7.679 22,6 4.721 30,8 4.886 24,0 14,9 -4,1 160 A(2) A-625 1 - Laudio - Luxaondo 13527 12,0 1<strong>2.</strong>538 12,0 1<strong>2.</strong>113 12,0 11.603 12,5 11.203 12,5 10.429 12,5 9.804 12,5 5,5 4,8 1060 A-625 2 360,2 Amurrio (Llodio) 11.236 9,2 11.395 19,2 1<strong>2.</strong>188 19,9 10.357 29,1 9.540 23,8 8.770 30,8 8.118 24,0 5,6 -10,0 161 A(2) A-625 2 - Luxaondo – Amurrio 10.251 12,0 10.132 12,0 9.562 12,0 8.815 12,0 8.544 12,0 8.430 12,0 7.946 11,8 4,3 4,6 1064 A-625 1 360,0 Circunva<strong>la</strong>ción <strong>de</strong> Amurrio 5.169 12,0 5.637 15,8 - - - - - - - - - - - - 161 B(2) A-625 3 - Amurrio – Vitoria-Gasteiz 4761 11,0 4.115 11,0 3.482 11,0 3.562 11,0 3.619 11,0 3.430 11,0 <strong>2.</strong>980 11,0 8,1 8,1 1063 A-625 3 358,2 Amurrio 4.749 12,4 3.766 19,2 3.637 19,9 <strong>2.</strong>824 29,1 <strong>2.</strong>289 22,7 1.708 30,9 1.968 32,4 15,8 -1,3 1061 A-625 3 356,0 Saratxo 4.798 12,2 3.613 19,2 3.956 19,9 4.054 29,1 3.893 22,2 4.291 30,9 4.539 32,5 0,9 -14,3 CARRETERA BI-625 (DE ORDUÑA A BILBAO): LÍMITE CON ÁLAVA – CRUCE CON N-634. BIZKAIA 154 A BI-625 1 384,9 E. Basauri - Moyordín (Arrigorriaga) 29.829 16,0 25.861 16,0 25.702 16,5 25.491 18,0 24.961 19,3 23.953 17,5 23.052 14,0 4,4 6,7 155 A BI-625 1 383,6 Moyordín - E. Arrigorriaga 2<strong>2.</strong>557 16,4 19.105 17,5 19.230 17,0 18.892 18,4 19.788 18,4 18.674 16,0 16.237 15,5 5,6 6,6 156 A BI-625 3 - BI-712 - Ugao (Miraballes) 20.512 11,5 17.822 11,5 17.354 11,8 16.388 13,5 17.550 13,5 17.027 13,0 15.428 13,0 4,9 2,7 157 A BI-625 0 380,6 157 C BI-625 3 - Arrigorriaga - Miraballes (Ugao) Miraballes (Ugao) - Arrankudiaga 18.561 11,5 17.019 11,6 16.636 10,9 15.948 13,5 17.180 13,5 16.667 12,3 15.103 11,9 3,5 2,9 1<strong>2.</strong>470 15,5 1<strong>2.</strong>078 15,5 11.812 15,0 11.763 16,0 1<strong>2.</strong>530 16,0 1<strong>2.</strong>141 15,5 10.866 13,0 2,3 5,4 158 A BI-625 1 - Arrankudiaga - E. Areta Norte 11.383 17,5 10.956 17,5 10.680 16,0 10.792 16,0 11.716 16,0 11.491 16,0 9.762 12,5 2,6 8,5 158 B BI-625 3 - E. Areta Norte - Areta 13.462 15,5 1<strong>2.</strong>617 15,5 1<strong>2.</strong>053 15,0 1<strong>2.</strong>252 15,0 1<strong>2.</strong>780 15,0 1<strong>2.</strong>653 14,50 11.714 11,0 2,3 8,4 162 A BI-625 2 - Amurrio - Orduña 4.414 9,0 4.329 9,0 4.155 9,0 4.076 9,0 4.124 9,0 4.060 9,5 3.594 9,5 3,5 2,5 CARRETERA GI-638 (DE DEBA A ONDARROA): DEBA (N-634) – LÍMITE CON BIZKAIA. GIPUZKOA 91 GI-638 3 1,3 Deba 5.225 11,0 4.976 - 4.577 - 4.949 - 5.029 - 5.768 - 3.944 - 4,8 - 49 GI-638 3 3,5 Entrada Mutriku 5.372 10,5 5.218 - 5.415 - 5.187 - 4.864 - 7.319 - 4.556 - 2,8 - 50 GI-638 3 7,2 Saturrarán 6.705 9,5 6.452 - 6.057 - 6.633 - 6.693 - 7.738 - 4.750 - 5,9 - CARRETERA BI-638 (DE DEBA A ONDARROA): LÍMITE CON GIPUZKOA - ONDARROA. BIZKAIA 149 C BI-638 2 - Ondarroa – L.P. (Deba) - - 6.601 8,0 6.533 8,0 6.407 8,0 6.476 8,0 6.146 8,0 5.668 8,0 - - (1): Estación primaria en el año 2000 y anteriores. (2): Estaciones <strong>de</strong> aforo obtenidas en <strong>la</strong> Diputación foral <strong>de</strong> Bizkaia, pero que correspon<strong>de</strong>n a <strong>la</strong> carretera A-625 <strong>de</strong> Á<strong>la</strong>va. Fuente: E<strong>la</strong>boración propia a partir <strong>de</strong> los datos <strong>de</strong> <strong>la</strong>s Diputaciones Forales <strong>de</strong> Á<strong>la</strong>va, Gipuzkoa y Bizkaia. Revisión <strong>de</strong>l Segundo P<strong>la</strong>n General <strong>de</strong> Carreteras <strong>de</strong>l País Vasco
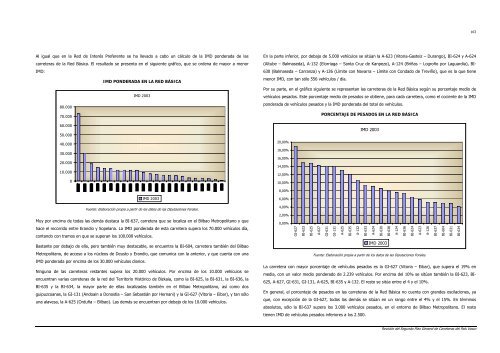
Al igual que en <strong>la</strong> Red <strong>de</strong> Interés Preferente se ha llevado a cabo un cálculo <strong>de</strong> <strong>la</strong> IMD pon<strong>de</strong>rada <strong>de</strong> <strong>la</strong>s carreteras <strong>de</strong> <strong>la</strong> Red Básica. El resultado se presenta en el siguiente gráfico, que se or<strong>de</strong>na <strong>de</strong> mayor a menor IMD: 80.000 70.000 60.000 50.000 40.000 30.000 20.000 10.000 0 IMD PONDERADA EN LA RED BÁSICA IMD 2003 IMD 2003 Fuente: E<strong>la</strong>boración propia a partir <strong>de</strong> los datos <strong>de</strong> <strong>la</strong>s Diputaciones Forales. Muy por encima <strong>de</strong> todas <strong>la</strong>s <strong>de</strong>más <strong>de</strong>staca <strong>la</strong> BI-637, carretera que se localiza en el Bilbao Metropolitano y que hace el recorrido entre Erandio y Sope<strong>la</strong>na. La IMD pon<strong>de</strong>rada <strong>de</strong> esta carretera supera los 70.000 vehículos día, contando con tramos en que se superan los 100.000 vehículos. Bastante por <strong>de</strong>bajo <strong>de</strong> el<strong>la</strong>, pero también muy <strong>de</strong>stacable, se encuentra <strong>la</strong> BI-604, carretera también <strong>de</strong>l Bilbao Metropolitano, <strong>de</strong> acceso a los núcleos <strong>de</strong> Deusto y Erandio, que comunica con <strong>la</strong> anterior, y que cuenta con una IMD pon<strong>de</strong>rada por encima <strong>de</strong> los 30.000 vehículos diarios. Ninguna <strong>de</strong> <strong>la</strong>s carreteras restantes supera los 20.000 vehículos. Por encima <strong>de</strong> los 10.000 vehículos se encuentran varias carreteras <strong>de</strong> <strong>la</strong> <strong>red</strong> <strong>de</strong>l Territorio Histórico <strong>de</strong> Bizkaia, como <strong>la</strong> BI-625, <strong>la</strong> BI-631, <strong>la</strong> BI-636, <strong>la</strong> BI-635 y <strong>la</strong> BI-634, <strong>la</strong> mayor parte <strong>de</strong> el<strong>la</strong>s localizadas también en el Bilbao Metropolitano, así como dos guipuzcoanas, <strong>la</strong> GI-131 (Andoain a Donostia – San Sebastián por Hernani) y <strong>la</strong> GI-627 (Vitoria – Eibar), y tan sólo una a<strong>la</strong>vesa, <strong>la</strong> A-625 (Orduña – Bilbao). Las <strong>de</strong>más se encuentran por <strong>de</strong>bajo <strong>de</strong> los 10.000 vehículos. En <strong>la</strong> parte inferior, por <strong>de</strong>bajo <strong>de</strong> 5.000 vehículos se sitúan <strong>la</strong> A-623 (Vitoria-Gasteiz – Durango), BI-624 y A-624 (Altube – Balmaseda), A-132 (Elorriaga – Santa Cruz <strong>de</strong> Kanpezo), A-124 (Briñas – Logroño por Laguardia), BI- 630 (Balmaseda – Carranza) y A-126 (Límite con Navarra – Límite con Condado <strong>de</strong> Treviño), que es <strong>la</strong> que tiene menor IMD, con tan sólo 556 vehículos / día. Por su parte, en el gráfico siguiente se representan <strong>la</strong>s carreteras <strong>de</strong> <strong>la</strong> Red Básica según su porcentaje medio <strong>de</strong> vehículos pesados. Este porcentaje medio <strong>de</strong> pesados se obtiene, para cada carretera, como el cociente <strong>de</strong> <strong>la</strong> IMD pon<strong>de</strong>rada <strong>de</strong> vehículos pesados y <strong>la</strong> IMD pon<strong>de</strong>rada <strong>de</strong>l total <strong>de</strong> vehículos. 20,00% 18,00% 16,00% 14,00% 12,00% 10,00% 8,00% 6,00% 4,00% 2,00% 0,00% GI-627 BI-623 BI-625 A-627 PORCENTAJE DE PESADOS EN LA RED BÁSICA GI-631 GI-131 A-625 BI-635 A-132 IMD 2003 BI-633 A-624 BI-630 IMD 2003 Fuente: E<strong>la</strong>boración propia a partir <strong>de</strong> los datos <strong>de</strong> <strong>la</strong>s Diputaciones Forales. La carretera con mayor porcentaje <strong>de</strong> vehículos pesados es <strong>la</strong> GI-627 (Vitoria – Eibar), que supera el 19% en media, con un valor medio pon<strong>de</strong>rado <strong>de</strong> <strong>2.</strong>239 vehículos. Por encima <strong>de</strong>l 10% se sitúan también <strong>la</strong> BI-623, BI- 625, A-627, GI-631, GI-131, A-625, BI-635 y A-13<strong>2.</strong> El resto se sitúa entre el 4 y el 10%. En general, el porcentaje <strong>de</strong> pesados en <strong>la</strong>s carreteras <strong>de</strong> <strong>la</strong> Red Básica no cuenta con gran<strong>de</strong>s osci<strong>la</strong>ciones, ya que, con excepción <strong>de</strong> <strong>la</strong> GI-627, todas <strong>la</strong>s <strong>de</strong>más se sitúan en un rango entre el 4% y el 15%. En términos absolutos, sólo <strong>la</strong> BI-637 supera los 3.000 vehículos pesados, en el entorno <strong>de</strong> Bilbao Metropolitano. El resto tienen IMD <strong>de</strong> vehículos pesados inferiores a los <strong>2.</strong>500. BI-638 A-124 BI-636 BI-624 A-623 A-126 163 Revisión <strong>de</strong>l Segundo P<strong>la</strong>n General <strong>de</strong> Carreteras <strong>de</strong>l País Vasco BI-637 BI-604 BI-631 BI-634
- Page 1 and 2:
2. ANÁLISIS DE LA SITUACIÓN ACTUA
- Page 3 and 4:
DISTRIBUCIÓN DE LA LONGITUD DE CAR
- Page 5 and 6:
En lo que se refiere a la Red de In
- Page 7 and 8:
DISTRIBUCIÓN DE LA RED BÁSICA SEG
- Page 9 and 10:
2,0 1,8 1,6 1,4 1,2 1,0 0,8 0,6 0,4
- Page 11 and 12:
RED OBJETO DE LA COMUNIDAD AUTÓNOM
- Page 13 and 14:
A la vista de estos datos de la Red
- Page 15 and 16:
0,25 0,20 0,15 0,10 0,05 0,00 DENSI
- Page 17 and 18:
Carretera N-622: de Vitoria-Gasteiz
- Page 19 and 20:
√ P.K. 18 a 30; radios inferiores
- Page 21 and 22:
Carretera Red de Interés Preferent
- Page 23 and 24:
2.1.2.3. Velocidades específicas A
- Page 26 and 27:
2.1.2.4. Caídas de Velocidad La p
- Page 29 and 30:
2.1.3 Radios de Curvatura El trazad
- Page 31 and 32:
Radios de Curvatura del Territorio
- Page 33 and 34:
Radios de Curvatura del Territorio
- Page 38 and 39:
2.1.4 Sección transversal 2.1.4.1.
- Page 40 and 41:
NÚMERO DE CARRILES EN LAS CARRETER
- Page 42 and 43:
NÚMERO DE CARRILES EN LAS AUTOPIST
- Page 44 and 45:
NÚMERO DE CARRILES EN LAS CARRETER
- Page 47 and 48:
2.1.4.2. Anchos de plataforma El es
- Page 49 and 50:
Anchos de Plataforma del Territorio
- Page 51 and 52:
Finalmente, en la Red Comarcal de B
- Page 53 and 54:
ANCHOS DE PLATAFORMA EN LAS CARRETE
- Page 58 and 59:
2.1.5 Posibilidad de adelantamiento
- Page 60:
Tal y como se observa en la gráfic
- Page 63 and 64:
DISTRIBUCIÓN DEL TOTAL DE ACCIDENT
- Page 65 and 66:
LESIVIDAD EN LAS CARRETERAS DE LA R
- Page 67 and 68:
Territorio Histórico de Álava ACC
- Page 69 and 70:
Territorio Histórico de Bizkaia AC
- Page 71 and 72:
Tipo de accidente Absoluto 1999 200
- Page 73 and 74:
DISTRIBUCIÓN DE ACCIDENTES SEGÚN
- Page 75 and 76:
En el conjunto de las carreteras de
- Page 77 and 78:
ACCIDENTES CON VÍCTIMAS SEGÚN MES
- Page 79 and 80:
ACCIDENTES SEGÚN MES EN LAS CARRET
- Page 81 and 82:
Carretera Accidentes con Víctimas
- Page 83 and 84:
Carretera Accidentes con Víctimas
- Page 85 and 86:
Carretera Accidentes con Víctimas
- Page 87 and 88:
Carretera Accidentes con Víctimas
- Page 89 and 90:
Carretera Accidentes con Víctimas
- Page 91 and 92:
EVOLUCIÓN DEL NÚMERO DE ACCIDENTE
- Page 93 and 94:
2.1.6.8. Accidentes por kilómetro
- Page 95 and 96:
Carretera Accidentes con Víctimas
- Page 97 and 98:
ACCIDENTES CON VÍCTIMAS POR KILÓM
- Page 99 and 100:
ACCIDENTES POR KILÓMETRO EN LA RED
- Page 101 and 102:
AUTOPISTAS, AUTOVÍAS Y CARRETERAS
- Page 103 and 104: DISTRIBUCIÓN DE TCA POR RANGOS DE
- Page 105: TCA EN LAS CARRETERAS DE LA RED FUN
- Page 108 and 109: INTERSECCIONES SEGÚN TIPOLOGÍA EN
- Page 111 and 112: 2.1.7.2. Red Funcional Además del
- Page 113 and 114: INTERSECCIONES POR KILÓMETRO EN LA
- Page 115 and 116: √ Número de semáforos. √ Núm
- Page 117 and 118: TRAVESÍAS DE CONFLICTIVIDAD ALTA E
- Page 119 and 120: TRAVESÍAS DE CONFLICTIVIDAD ALTA E
- Page 121: La distribución de TCAs en traves
- Page 124 and 125: A continuación se presenta la evol
- Page 126 and 127: En la siguiente tabla se presentan
- Page 128 and 129: Estación Carretera Tipo P.K. Local
- Page 130 and 131: Estación Carretera Tipo P.K. Local
- Page 132 and 133: Estación Carretera Tipo P.K. Local
- Page 134 and 135: Estación Carretera Tipo P.K. Local
- Page 136 and 137: Por su parte, aquellas carreteras d
- Page 138 and 139: 20.00% 18.00% 16.00% 14.00% 12.00%
- Page 140 and 141: INTENSIDAD DE PESADOS EN LA CARRETE
- Page 142 and 143: INTENSIDAD DE PESADOS EN LA CARRETE
- Page 144 and 145: PORCENTAJE DE PESADOS EN LA CARRETE
- Page 146 and 147: PORCENTAJE DE PESADOS EN LA CARRETE
- Page 148 and 149: El acceso al Aeropuerto de Loiu, en
- Page 150 and 151: Estación Carretera Tipo P.K. Local
- Page 152 and 153: Estación Carretera Tipo P.K. Local
- Page 156 and 157: Se presenta a continuación un grá
- Page 158 and 159: 4,500 4,000 3,500 3,000 2,500 2,000
- Page 160 and 161: INTENSIDAD DE TRÁFICO EN LA CARRET
- Page 162 and 163: INTENSIDAD DE TRÁFICO EN LA CARRET
- Page 164 and 165: INTENSIDAD DE TRÁFICO EN LA CARRET
- Page 166 and 167: 40.000 35.000 30.000 25.000 20.000
- Page 168 and 169: INTENSIDAD DE TRÁFICO EN LA CARRET
- Page 170 and 171: INTENSIDAD DE TRÁFICO EN LA CARRET
- Page 172 and 173: INTENSIDAD DE TRÁFICO EN LAS CARRE
- Page 174 and 175: INTENSIDAD DE TRÁFICO EN LAS CARRE
- Page 176 and 177: Estación Carretera Tipo P.K. Local
- Page 178 and 179: Estación Carretera Tipo P.K. Local
- Page 180 and 181: Estación Carretera Tipo P.K. Local
- Page 182 and 183: FLUJOS TOTALES DE TRÁFICO EN LA RE
- Page 184 and 185: Estación Carretera P.K. Localidad
- Page 186 and 187: Estación Carretera P.K. Localidad
- Page 188 and 189: Estación Carretera P.K. Localidad
- Page 190 and 191: De manera análoga al análisis ant
- Page 192 and 193: Estación Carretera P.K. Localidad
- Page 194 and 195: Estación Carretera P.K. Localidad
- Page 196 and 197: Estación Carretera P.K. Localidad
- Page 198 and 199: Por último, de la Red Comarcal las
- Page 200 and 201: Estación Carretera P.K. Localidad
- Page 202 and 203: Estación Carretera P.K. Localidad
- Page 204 and 205:
Estación Carretera P.K. Localidad
- Page 206 and 207:
Estación Carretera P.K. Localidad
- Page 208 and 209:
Estación Carretera P.K. Localidad
- Page 210 and 211:
Estación Carretera P.K. Localidad
- Page 212 and 213:
40,00% 35,00% 30,00% 25,00% 20,00%
- Page 214 and 215:
25,00% 20,00% 15,00% 10,00% TRÁFIC
- Page 216 and 217:
80,00% 70,00% 60,00% 50,00% 40,00%
- Page 218 and 219:
2.2.2.6. Evolución del Tráfico se
- Page 223 and 224:
2.2.3 Capacidad de la red y niveles
- Page 225 and 226:
Cuando el tráfico no está formado
- Page 227 and 228:
2.2.3.2. Situación actual en la Re
- Page 229 and 230:
Respecto al conjunto de la Comunida
- Page 231 and 232:
NIVEL DE SERVICIO EN EL TERRITORIO
- Page 234 and 235:
2.2.3.3. Resto de la Red Funcional
- Page 236 and 237:
2.3. CARACTERIZACIÓN DE LA MOVILID
- Page 238 and 239:
La cuota de reparto modal correspon
- Page 240 and 241:
2.3.1.2. Transporte de mercancías
- Page 242 and 243:
La cuota de reparto modal correspon
- Page 244 and 245:
2.3.2 Transporte por carretera 2.3.
- Page 246 and 247:
En el día medio del año 2003 la d
- Page 248 and 249:
Naturaleza del viaje TONELADAS TRAN
- Page 250 and 251:
Naturaleza del viaje EuskoTren Cer.
- Page 252 and 253:
√ Núcleo de Donostia-San Sebasti
- Page 254 and 255:
Naturaleza del viaje DEMANDA DE TRA
- Page 256 and 257:
2.4. LA MOVILIDAD EN LA RED FUNCION
- Page 258 and 259:
Origen Destino Itinerario Total Lig
- Page 260 and 261:
Origen Destino Itinerario Total Lig
- Page 262 and 263:
Origen Destino Itinerario Total Lig
- Page 264 and 265:
Origen Destino Itinerario Total Lig
- Page 266 and 267:
Por último, la matriz Origen / Des
- Page 268 and 269:
ESQUEMA METODOLÓGICO 276 Revisión
- Page 270 and 271:
PUNTOS DE CONTROL DE AFOROS. AÑO 2
- Page 272 and 273:
Origen Interno País Vasco Externo
- Page 274:
Zonificación Nombre Zona Zonificac
- Page 277 and 278:
√ Estratificación de la demanda
- Page 280:
2.5.6 Isocronas Con el fin de visua
- Page 289:
Las zonas que presentan mejor acces