<strong>2.</strong>4. LA MOVILIDAD EN LA RED FUNCIONAL DEL PAÍS VASCO Se han analizado <strong>la</strong>s distribuciones <strong>de</strong> los tráficos entre los diferentes itinerarios alternativos existentes para <strong>la</strong>s principales re<strong>la</strong>ciones origen – <strong>de</strong>stino en <strong>la</strong> <strong>red</strong> <strong>viaria</strong> <strong>de</strong>l País Vasco, consi<strong>de</strong>rándose tanto los tráficos internos al País Vasco, y los que tienen su origen o <strong>de</strong>stino fuera <strong>de</strong>l mismo, como los exteriores al País Vasco pero que en su tránsito por este territorio utilizan <strong>la</strong> Red Funcional. Las bases documentales empleadas en el <strong>análisis</strong> han sido <strong>la</strong>s encuestas <strong>de</strong> carretera realizadas por el Gobierno Vasco para los estudios <strong>de</strong> “Imagen Final <strong>de</strong> <strong>la</strong> Demanda <strong>de</strong> Transporte en el País Vasco” correspondientes a los años 1995 y 2001. Las principales re<strong>la</strong>ciones <strong>de</strong>tectadas son <strong>la</strong>s siguientes: 1. A.F. Balmaseda - Zal<strong>la</strong> Bilbao Metropolitano 2 A.F. Beasain - Zumarraga Arrasate - Bergara Donostia-San Sebastián 3. A.F. Bilbao Metropolitano Cornisa Cantábrica Durango Balmaseda - Zal<strong>la</strong> Donostia-San Sebastián Mungia Llodio Vitoria-Gasteiz Eibar Gernika Madrid 4. A.F. Donostia-San Sebastián Francia y Resto U.E. Zarautz - Azpeitia Navarra 5. A.F. Durango Bilbao Metropolitano 7. A.F. Gernika Bilbao Metropolitano 8. A.F. Igorre Bilbao Metropolitano 10. A.F. Llodio Bilbao Metropolitano 11. A.F. Arrasate - Bergara Beasain - Zumarraga Donostia-San Sebastián Vitoria-Gasteiz 1<strong>2.</strong> A.F. Mungia Bilbao Metropolitano 13. A.F. Tolosa Donostia-San Sebastián 14. A.F. Vitoria-Gasteiz Bilbao Metropolitano Arrasate - Bergara Navarra Burgos Beasain - Zumarraga Donostia-San Sebastián 15. A.F. Zarautz - Azpeitia Donostia-San Sebastián Navarra Donostia-San Sebastián Vitoria-Gasteiz Europa Castil<strong>la</strong> - León Vitoria-Gasteiz Bilbao Metropolitano Donostia-San Sebastián La Rioja Vitoria-Gasteiz Bilbao Metropolitano Donostia-San Sebastián Cataluña Cornisa Cantábrica Vitoria-Gasteiz Donostia-San Sebastián Bilbao Metropolitano Comunidad Valenciana Bilbao Metropolitano Donostia-San Sebastián Madrid Bilbao Metropolitano Portugal Europa Francia Donostia-San Sebastián Burgos Vitoria-Gasteiz Bilbao Metropolitano A partir <strong>de</strong> <strong>la</strong>s explotaciones <strong>de</strong> <strong>la</strong>s encuestas realizadas se han obtenido los flujos <strong>de</strong> tráfico (vehículos ligeros, pesados y total) en los itinerarios interiores y exteriores a <strong>la</strong> CAPV en el día medio <strong>de</strong>l año 2001, así como <strong>la</strong>s matrivces O / D (ambos sentidos) para cada tipología <strong>de</strong> vehículo consi<strong>de</strong>rada. 264 Revisión <strong>de</strong>l Segundo P<strong>la</strong>n General <strong>de</strong> Carreteras <strong>de</strong>l País Vasco
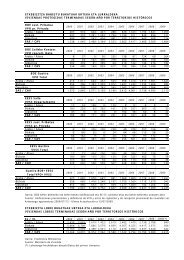
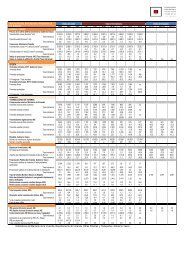
ITINERARIOS INTERIORES A LA CAPV: FLUJOS DE TRÁFICO EN LA RED FUNCIONAL DE CARRETERAS DÍA MEDIO DEL AÑO 2001 Origen Destino Itinerario Total Ligeros Total Pesados Total Vehículos Total Pasajeros Total Mercancías (Tn) Beasain - Zumarraga Vitoria-Gasteiz Bilbao Metropolitano Donostia-San Sebastián Donostia-San Sebastián Durango Igorre Mungia Vitoria-Gasteiz Bilbao Metropolitano Arrasate - Bergara Vitoria-Gasteiz N-I 585 89,1% 163 100,0% 748 91,3% 790 88,4% 1.106 100,0% GI-627 / N-636 72 10,9% 0 0,0% 72 8,7% 104 11,6% 0 0,0% Total 657 100,0% 163 100,0% 820 100,0% 894 100,0% 1.106 100,0% A-8 1.970 81,7% 476 62,7% <strong>2.</strong>446 77,2% 3.359 96,0% 4.050 59,9% N-634 441 18,3% 282 37,3% 724 22,8% 141 4,0% <strong>2.</strong>716 40,1% Total <strong>2.</strong>412 100,0% 758 100,0% 3.170 100,0% 3.500 100,0% 6.766 100,0% A-8 <strong>2.</strong>922 36,2% 216 15,3% 3.138 33,1% 3.498 36,6% 1.014 36,1% N-634 5.142 63,8% 1.191 84,7% 6.333 66,9% 6.057 63,4% 1.791 63,9% Total 8.064 100,0% 1.407 100,0% 9.471 100,0% 9.555 100,0% <strong>2.</strong>805 100,0% A-8 15 0,3% 0 0,0% 15 0,2% 17 0,3% 0 0,0% N-634 5.431 99,7% 472 100,0% 5.903 99,8% 6.628 99,7% 452 100,0% Total 5.446 100,0% 472 100,0% 5.918 100,0% 6.645 100,0% 452 100,0% BI-631 6.791 91,9% 352 92,1% 7.143 91,9% 9.466 94,1% 284 90,4% BI-634 414 5,6% 0 0,0% 414 5,3% 343 3,4% 0 0,0% BI-2122 0 0,0% 30 7,9% 30 0,4% 0 0,0% 30 9,6% BI-2704 182 2,5% 0 0,0% 182 2,3% 248 2,5% 0 0,0% Total 7.387 100,0% 382 100,0% 7.769 100,0% 10.058 100,0% 315 100,0% A-68 / N-622 3.873 87,6% 256 45,8% 4.128 82,9% 4.482 87,8% 3.535 51,1% N-240 550 12,4% 303 54,2% 852 17,1% 625 12,2% 3.376 48,9% Total 4.422 100,0% 558 100,0% 4.981 100,0% 5.106 100,0% 6.911 100,0% A-8 <strong>2.</strong>310 92,2% 467 84,1% <strong>2.</strong>777 90,7% 5.163 98,1% 3.262 98,8% N-634 196 7,8% 88 15,9% 284 9,3% 102 1,9% 40 1,2% Total <strong>2.</strong>506 100,0% 555 100,0% 3.061 100,0% 5.265 100,0% 3.302 100,0% N-634 / N-I 1.090 77,8% 0 0,0% 1.090 69,0% 1.098 73,4% 16 3,0% A-8 / GI-627 284 20,3% 18 10,2% 302 19,1% 358 24,0% 231 43,8% N-634 / GI-627 28 2,0% 160 89,8% 187 11,9% 40 2,7% 280 53,1% Total 1.402 100,0% 178 100,0% 1.579 100,0% 1.496 100,0% 526 100,0% N-I 981 88,4% 112 74,2% 1.093 86,7% 1.739 93,8% 538 96,1% N-622 / A-68 / A-8 8 0,7% 4 2,4% 11 0,9% 9 0,5% 22 3,9% N-240 / A-BI-623 / A-8 65 5,9% 0 0,0% 65 5,2% 77 4,1% 0 0,0% N-240 / A-BI-627 / A-8 0 0,0% 0 0,0% 0 0,0% 0 0,0% 0 0,0% N-I / N-240 / A-15 / N-I 24 2,2% 0 0,0% 24 1,9% 29 1,6% 0 0,0% N-240 / A-BI-623 / N-634 32 2,9% 35 23,3% 67 5,3% 0 0,0% 0 0,0% Total 1.110 100,0% 151 100,0% 1.261 100,0% 1.854 100,0% 561 100,0% 265 Revisión <strong>de</strong>l Segundo P<strong>la</strong>n General <strong>de</strong> Carreteras <strong>de</strong>l País Vasco
- Page 1 and 2:
2. ANÁLISIS DE LA SITUACIÓN ACTUA
- Page 3 and 4:
DISTRIBUCIÓN DE LA LONGITUD DE CAR
- Page 5 and 6:
En lo que se refiere a la Red de In
- Page 7 and 8:
DISTRIBUCIÓN DE LA RED BÁSICA SEG
- Page 9 and 10:
2,0 1,8 1,6 1,4 1,2 1,0 0,8 0,6 0,4
- Page 11 and 12:
RED OBJETO DE LA COMUNIDAD AUTÓNOM
- Page 13 and 14:
A la vista de estos datos de la Red
- Page 15 and 16:
0,25 0,20 0,15 0,10 0,05 0,00 DENSI
- Page 17 and 18:
Carretera N-622: de Vitoria-Gasteiz
- Page 19 and 20:
√ P.K. 18 a 30; radios inferiores
- Page 21 and 22:
Carretera Red de Interés Preferent
- Page 23 and 24:
2.1.2.3. Velocidades específicas A
- Page 26 and 27:
2.1.2.4. Caídas de Velocidad La p
- Page 29 and 30:
2.1.3 Radios de Curvatura El trazad
- Page 31 and 32:
Radios de Curvatura del Territorio
- Page 33 and 34:
Radios de Curvatura del Territorio
- Page 38 and 39:
2.1.4 Sección transversal 2.1.4.1.
- Page 40 and 41:
NÚMERO DE CARRILES EN LAS CARRETER
- Page 42 and 43:
NÚMERO DE CARRILES EN LAS AUTOPIST
- Page 44 and 45:
NÚMERO DE CARRILES EN LAS CARRETER
- Page 47 and 48:
2.1.4.2. Anchos de plataforma El es
- Page 49 and 50:
Anchos de Plataforma del Territorio
- Page 51 and 52:
Finalmente, en la Red Comarcal de B
- Page 53 and 54:
ANCHOS DE PLATAFORMA EN LAS CARRETE
- Page 58 and 59:
2.1.5 Posibilidad de adelantamiento
- Page 60:
Tal y como se observa en la gráfic
- Page 63 and 64:
DISTRIBUCIÓN DEL TOTAL DE ACCIDENT
- Page 65 and 66:
LESIVIDAD EN LAS CARRETERAS DE LA R
- Page 67 and 68:
Territorio Histórico de Álava ACC
- Page 69 and 70:
Territorio Histórico de Bizkaia AC
- Page 71 and 72:
Tipo de accidente Absoluto 1999 200
- Page 73 and 74:
DISTRIBUCIÓN DE ACCIDENTES SEGÚN
- Page 75 and 76:
En el conjunto de las carreteras de
- Page 77 and 78:
ACCIDENTES CON VÍCTIMAS SEGÚN MES
- Page 79 and 80:
ACCIDENTES SEGÚN MES EN LAS CARRET
- Page 81 and 82:
Carretera Accidentes con Víctimas
- Page 83 and 84:
Carretera Accidentes con Víctimas
- Page 85 and 86:
Carretera Accidentes con Víctimas
- Page 87 and 88:
Carretera Accidentes con Víctimas
- Page 89 and 90:
Carretera Accidentes con Víctimas
- Page 91 and 92:
EVOLUCIÓN DEL NÚMERO DE ACCIDENTE
- Page 93 and 94:
2.1.6.8. Accidentes por kilómetro
- Page 95 and 96:
Carretera Accidentes con Víctimas
- Page 97 and 98:
ACCIDENTES CON VÍCTIMAS POR KILÓM
- Page 99 and 100:
ACCIDENTES POR KILÓMETRO EN LA RED
- Page 101 and 102:
AUTOPISTAS, AUTOVÍAS Y CARRETERAS
- Page 103 and 104:
DISTRIBUCIÓN DE TCA POR RANGOS DE
- Page 105:
TCA EN LAS CARRETERAS DE LA RED FUN
- Page 108 and 109:
INTERSECCIONES SEGÚN TIPOLOGÍA EN
- Page 111 and 112:
2.1.7.2. Red Funcional Además del
- Page 113 and 114:
INTERSECCIONES POR KILÓMETRO EN LA
- Page 115 and 116:
√ Número de semáforos. √ Núm
- Page 117 and 118:
TRAVESÍAS DE CONFLICTIVIDAD ALTA E
- Page 119 and 120:
TRAVESÍAS DE CONFLICTIVIDAD ALTA E
- Page 121:
La distribución de TCAs en traves
- Page 124 and 125:
A continuación se presenta la evol
- Page 126 and 127:
En la siguiente tabla se presentan
- Page 128 and 129:
Estación Carretera Tipo P.K. Local
- Page 130 and 131:
Estación Carretera Tipo P.K. Local
- Page 132 and 133:
Estación Carretera Tipo P.K. Local
- Page 134 and 135:
Estación Carretera Tipo P.K. Local
- Page 136 and 137:
Por su parte, aquellas carreteras d
- Page 138 and 139:
20.00% 18.00% 16.00% 14.00% 12.00%
- Page 140 and 141:
INTENSIDAD DE PESADOS EN LA CARRETE
- Page 142 and 143:
INTENSIDAD DE PESADOS EN LA CARRETE
- Page 144 and 145:
PORCENTAJE DE PESADOS EN LA CARRETE
- Page 146 and 147:
PORCENTAJE DE PESADOS EN LA CARRETE
- Page 148 and 149:
El acceso al Aeropuerto de Loiu, en
- Page 150 and 151:
Estación Carretera Tipo P.K. Local
- Page 152 and 153:
Estación Carretera Tipo P.K. Local
- Page 154 and 155:
Estación Carretera Tipo P.K. Local
- Page 156 and 157:
Se presenta a continuación un grá
- Page 158 and 159:
4,500 4,000 3,500 3,000 2,500 2,000
- Page 160 and 161:
INTENSIDAD DE TRÁFICO EN LA CARRET
- Page 162 and 163:
INTENSIDAD DE TRÁFICO EN LA CARRET
- Page 164 and 165:
INTENSIDAD DE TRÁFICO EN LA CARRET
- Page 166 and 167:
40.000 35.000 30.000 25.000 20.000
- Page 168 and 169:
INTENSIDAD DE TRÁFICO EN LA CARRET
- Page 170 and 171:
INTENSIDAD DE TRÁFICO EN LA CARRET
- Page 172 and 173:
INTENSIDAD DE TRÁFICO EN LAS CARRE
- Page 174 and 175:
INTENSIDAD DE TRÁFICO EN LAS CARRE
- Page 176 and 177:
Estación Carretera Tipo P.K. Local
- Page 178 and 179:
Estación Carretera Tipo P.K. Local
- Page 180 and 181:
Estación Carretera Tipo P.K. Local
- Page 182 and 183:
FLUJOS TOTALES DE TRÁFICO EN LA RE
- Page 184 and 185:
Estación Carretera P.K. Localidad
- Page 186 and 187:
Estación Carretera P.K. Localidad
- Page 188 and 189:
Estación Carretera P.K. Localidad
- Page 190 and 191:
De manera análoga al análisis ant
- Page 192 and 193:
Estación Carretera P.K. Localidad
- Page 194 and 195:
Estación Carretera P.K. Localidad
- Page 196 and 197:
Estación Carretera P.K. Localidad
- Page 198 and 199:
Por último, de la Red Comarcal las
- Page 200 and 201:
Estación Carretera P.K. Localidad
- Page 202 and 203:
Estación Carretera P.K. Localidad
- Page 204 and 205:
Estación Carretera P.K. Localidad
- Page 206 and 207: Estación Carretera P.K. Localidad
- Page 208 and 209: Estación Carretera P.K. Localidad
- Page 210 and 211: Estación Carretera P.K. Localidad
- Page 212 and 213: 40,00% 35,00% 30,00% 25,00% 20,00%
- Page 214 and 215: 25,00% 20,00% 15,00% 10,00% TRÁFIC
- Page 216 and 217: 80,00% 70,00% 60,00% 50,00% 40,00%
- Page 218 and 219: 2.2.2.6. Evolución del Tráfico se
- Page 223 and 224: 2.2.3 Capacidad de la red y niveles
- Page 225 and 226: Cuando el tráfico no está formado
- Page 227 and 228: 2.2.3.2. Situación actual en la Re
- Page 229 and 230: Respecto al conjunto de la Comunida
- Page 231 and 232: NIVEL DE SERVICIO EN EL TERRITORIO
- Page 234 and 235: 2.2.3.3. Resto de la Red Funcional
- Page 236 and 237: 2.3. CARACTERIZACIÓN DE LA MOVILID
- Page 238 and 239: La cuota de reparto modal correspon
- Page 240 and 241: 2.3.1.2. Transporte de mercancías
- Page 242 and 243: La cuota de reparto modal correspon
- Page 244 and 245: 2.3.2 Transporte por carretera 2.3.
- Page 246 and 247: En el día medio del año 2003 la d
- Page 248 and 249: Naturaleza del viaje TONELADAS TRAN
- Page 250 and 251: Naturaleza del viaje EuskoTren Cer.
- Page 252 and 253: √ Núcleo de Donostia-San Sebasti
- Page 254 and 255: Naturaleza del viaje DEMANDA DE TRA
- Page 258 and 259: Origen Destino Itinerario Total Lig
- Page 260 and 261: Origen Destino Itinerario Total Lig
- Page 262 and 263: Origen Destino Itinerario Total Lig
- Page 264 and 265: Origen Destino Itinerario Total Lig
- Page 266 and 267: Por último, la matriz Origen / Des
- Page 268 and 269: ESQUEMA METODOLÓGICO 276 Revisión
- Page 270 and 271: PUNTOS DE CONTROL DE AFOROS. AÑO 2
- Page 272 and 273: Origen Interno País Vasco Externo
- Page 274: Zonificación Nombre Zona Zonificac
- Page 277 and 278: √ Estratificación de la demanda
- Page 280: 2.5.6 Isocronas Con el fin de visua
- Page 289: Las zonas que presentan mejor acces