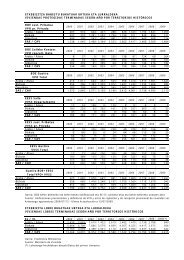
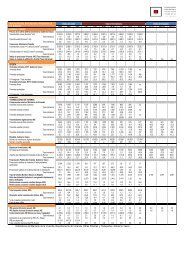
Estación Carretera Tipo P.K. Localidad más próxima IMD 2003 2002 2001 2000 1999 1998 1997 % Pesados IMD % Pesados IMD % Pesados IMD % Pesados IMD % Pesados IMD % Pesados IMD % Pesados 188 Variación (%) 1997 - 2003 IMD Pesados 92 A BI-2704 2 - Loiu - Unbe 6.525 4,0 6.381 4,0 6.304 4,0 6.312 4,0 5.877 4,0 5.904 5,0 3.841 6,0 9,2 2,1 93 A BI-2704 1 13,1 Unbe – Alto Unbe 5.947 4,0 5.356 4,0 5.732 4,0 6.036 4,0 5.979 4,0 6.405 4,5 5.212 6,5 2,2 -5,7 93 C BI-2704 3 - Alto Unbe – BI-3724 (Urberuaga) 4.889 4,0 4.673 4,0 5.001 4,0 6.449 4,0 5.334 4,5 5.413 6,0 4.513 6,0 1,3 -5,3 94 A BI-2704 3 - BI-3724 – Elortza (Urduliz) 4.396 4,0 4.175 4,0 4.110 4,0 4.056 4,0 3.845 4,5 4.175 5,0 3.481 6,0 4,0 -2,8 89 B BI-2704 2 - Plentzia – Elortza (Urduliz) 5.309 5,0 5.231 5,0 5.348 5,0 5.781 5,0 5.606 4,0 5.455 6,0 4.543 6,0 2,6 -0,4 CARRETERA BI-2543: IGORRE - OTXANDÍO POR DIMA. BIZKAIA 173 C BI-2543 3 - Dima - Otxandio 531 6,5 539 6,5 494 6,5 508 6,5 498 6,5 424 7,0 403 7,0 4,7 3,4 170 A BI-2543 3 - Igorre - Dima <strong>2.</strong>333 10,0 <strong>2.</strong>377 10,0 <strong>2.</strong>326 10,0 <strong>2.</strong>399 10,0 <strong>2.</strong>217 10,0 <strong>2.</strong>134 10,0 <strong>2.</strong>060 10,0 2,1 2,1 165 B BI-2543 3 - Igorre - Dima <strong>2.</strong>560 8,0 <strong>2.</strong>446 8,0 <strong>2.</strong>494 8,0 <strong>2.</strong>642 8,5 <strong>2.</strong>818 8,5 <strong>2.</strong>349 10,0 <strong>2.</strong>310 10,0 1,7 -2,0 CARRETERA BI-2701: MUSKIZ – MALABRIGO POR SOPUERTA. BIZKAIA 41 C BI-2701 3 - Muskiz – El Arenao 6.447 7,0 6.201 7,0 5.994 7,0 6.338 7,0 5.995 7,0 5.833 8,0 5.573 8,0 2,5 0,2 67 A BI-2701 1 - Muskiz – El Arenao 6.301 6,5 5.908 7,0 5.717 7,0 5.633 7,0 5.561 7,0 5.422 8,0 5.292 8,0 3,0 -0,6 68 A BI-2701 3 - El Arenao – Merkadillo (Sopuerta) 5.184 7,0 5.051 7,0 4.822 7,0 4.603 7,0 4.402 7,0 4.328 8,0 3.899 8,0 4,9 2,6 69 A BI-2701 3 - Merkadillo – El Carral 3.520 8,0 3.487 8,0 3.247 8,0 3.257 8,0 3.165 8,0 3.054 8,0 <strong>2.</strong>892 8,0 3,3 3,3 69 C BI-2701 3 - El Carral - Avel<strong>la</strong>neda 3.115 8,0 <strong>2.</strong>836 8,0 <strong>2.</strong>731 8,0 <strong>2.</strong>663 8,0 <strong>2.</strong>786 8,0 <strong>2.</strong>757 8,0 <strong>2.</strong>655 8,0 2,7 2,7 70 A BI-2701 3 - Avel<strong>la</strong>neda - Reto<strong>la</strong> 3.054 8,0 3.044 8,0 <strong>2.</strong>918 8,0 <strong>2.</strong>761 8,0 <strong>2.</strong>689 8,0 <strong>2.</strong>608 8,0 <strong>2.</strong>533 8,0 3,2 3,2 70 B BI-2701 3 - Reto<strong>la</strong> - Ma<strong>la</strong>brigo - - 3.372 8,0 3.359 8,0 3.272 8,0 3.140 8,0 3.007 8,0 <strong>2.</strong>811 8,0 - - 62 B BI-2701 3 - Ma<strong>la</strong>brigo - Reto<strong>la</strong> 3.332 8,0 3.473 8,0 3.145 8,0 3.192 8,0 3.040 8,0 <strong>2.</strong>875 8,0 <strong>2.</strong>628 8,0 4,0 4,0 CARRETERA BI-2617: VILLAVER DE TRUCIOS – AGÜERA. BIZKAIA 64 B BI-2617 3 - Turtioz – L.P. Cantabria 1.198 6,0 1.203 6,0 1.221 6,0 1.143 6,0 1.003 6,0 971 6,0 903 6,0 4,8 4,8 CARRETERA BI-2122: SOPELANA - PLENTZIA. BIZKAIA 88 C BI-2122 3 - Sope<strong>la</strong>na - Barrika 10.180 5,0 10.673 5,0 10.251 5,0 10.108 5,0 9.130 5,0 8.826 5,0 8.443 5,0 3,2 3,2 89 A BI-2122 2 - Barrika - Plentzia 6.793 4,0 6.862 4,0 7.275 4,0 6.938 4,0 6.483 4,0 6.366 4,0 6.014 4,0 2,1 2,1 CARRETERA BI-2521: ORDUÑA - ALTUBE. BIZKAIA No tiene estaciones <strong>de</strong> aforo. CARRETERA BI-2625: PANCORBO - ORDUÑA. BIZKAIA 162 B BI-2625 2 - Orduña – L.P. Burgos 1.085 6,0 1.044 6,0 1.132 6,0 1.345 6,0 1.363 6,0 1.357 6,0 1.331 6,0 -3,3 -3,3 Fuente: E<strong>la</strong>boración propia a partir <strong>de</strong> los datos <strong>de</strong> <strong>la</strong>s Diputaciones Forales <strong>de</strong> Á<strong>la</strong>va, Gipuzkoa y Bizkaia. Revisión <strong>de</strong>l Segundo P<strong>la</strong>n General <strong>de</strong> Carreteras <strong>de</strong>l País Vasco
En el siguiente gráfico, figura <strong>la</strong> tasa <strong>de</strong> crecimiento medio acumu<strong>la</strong>tivo anual en el período 1997 – 2003 en <strong>la</strong>s carreteras <strong>de</strong> <strong>la</strong> Red Comarcal que forman parte <strong>de</strong> <strong>la</strong> Red Funcional. 14,0 12,0 10,0 8,0 6,0 4,0 2,0 0,0 -2,0 -4,0 -6,0 VARIACIÓN DE LA INTENSIDAD DE TRÁFICO (%) EN LA RED COMARCAL PERÍODO 1997 – 2003 IMD IMD Fuente: E<strong>la</strong>boración propia a partir <strong>de</strong> los datos <strong>de</strong> <strong>la</strong>s Diputaciones Forales. En el período 1997 – 2003, <strong>la</strong>s carreteras A-2604 (Gor<strong>de</strong>liz – Límite con Bizkaia pasando por Artziniega), <strong>la</strong> GI-2130 (<strong>de</strong> Tolosa al límite <strong>de</strong> <strong>la</strong> provincia <strong>de</strong> Navarra pasando por el puerto <strong>de</strong> Urto) y <strong>la</strong> A-2128 (Santa Cruz <strong>de</strong> Kanpezo – Salvatierra) son <strong>la</strong>s que mayor crecimiento han experimentado con porcentajes que, respectivamente, superan el 12%, 10% y 9%. Tan solo el 12% <strong>de</strong> <strong>la</strong>s carreteras <strong>de</strong> <strong>la</strong> Red Comarcal que forman parte <strong>de</strong> <strong>la</strong> Red Funcional, tienen una variación negativa <strong>de</strong>l tráfico en el período <strong>de</strong> estudio consi<strong>de</strong>rado. Son <strong>la</strong>s carreteras BI-2238 (Gernika- Lumo – Lekeito), A-2124 (Vitoria-Gasteiz – Leza), A-2122 (Zubil<strong>la</strong>ga – Sobrón y BI-2625 (Pancorbo – Orduña), siendo esta última carretera don<strong>de</strong> dicho <strong>de</strong>crecimiento ha sido el mayor <strong>de</strong> todos (-4%). 30,0 25,0 20,0 15,0 10,0 5,0 0,0 -5,0 -10,0 VARIACIÓN DE LA INTENSIDAD DE PESADOS (%) EN LA RED COMARCAL PERÍODO 1997 – 2003 Pesados Pesados Fuente: E<strong>la</strong>boración propia a partir <strong>de</strong> los datos <strong>de</strong> <strong>la</strong>s Diputaciones Forales. Por su parte, con respecto a aquel<strong>la</strong>s carreteras <strong>de</strong> <strong>la</strong>s que se dispone <strong>de</strong> datos, <strong>la</strong> variación <strong>de</strong> vehículos pesados es mucho mayor que <strong>la</strong> variación <strong>de</strong>l tráfico total, <strong>de</strong>stacando <strong>la</strong> carretera A-2124 en <strong>la</strong> que el tráfico total <strong>de</strong>crece un –1.1% y el tráfico <strong>de</strong> pesados aumenta con una tasa anual <strong>de</strong>l 25,8%. Hay a<strong>de</strong>más, tres carreteras más con tasas <strong>de</strong> crecimiento acumu<strong>la</strong>tivo anual superiores al 14%, son <strong>la</strong>s A-2604 (Gor<strong>de</strong>liz – Límite con Bizkaia pasando por Artziniega), A-2134 (en Vitoria-Gasteiz) y A-2122 (Zubil<strong>la</strong>ga - Sobrón). <strong>2.</strong><strong>2.</strong><strong>2.</strong>4. Flujos <strong>de</strong> tráfico en los años 2002 y 2003 Flujo total En <strong>la</strong> siguiente tab<strong>la</strong> figuran <strong>la</strong>s carreteras <strong>de</strong> <strong>la</strong> Red Funcional c<strong>la</strong>sificadas en función <strong>de</strong> los flujos totales <strong>de</strong> tráfico canalizados (IMD en el año 2002), tanto <strong>de</strong> <strong>la</strong> Red <strong>de</strong> Interés Preferente como <strong>de</strong> <strong>la</strong> Red Básica y <strong>de</strong> <strong>la</strong> Red Comarcal. Los rangos <strong>de</strong> tráfico consi<strong>de</strong>rados son los mismos que figuran en el P<strong>la</strong>n <strong>de</strong> Carreteras vigente (superior a 80.000 vehículos / día, entre 40.000 y 80.000 vehículos / día, entre 20.000 y 40.000 vehículos / día, entre 10.000 y 20.000 vehículos / día, entre 5.000 y 10.000 vehículos / día, entre <strong>2.</strong>000 y 5.000 vehículos / día y por último inferior a <strong>2.</strong>000 vehículos / día). 189 Revisión <strong>de</strong>l Segundo P<strong>la</strong>n General <strong>de</strong> Carreteras <strong>de</strong>l País Vasco
- Page 1 and 2:
2. ANÁLISIS DE LA SITUACIÓN ACTUA
- Page 3 and 4:
DISTRIBUCIÓN DE LA LONGITUD DE CAR
- Page 5 and 6:
En lo que se refiere a la Red de In
- Page 7 and 8:
DISTRIBUCIÓN DE LA RED BÁSICA SEG
- Page 9 and 10:
2,0 1,8 1,6 1,4 1,2 1,0 0,8 0,6 0,4
- Page 11 and 12:
RED OBJETO DE LA COMUNIDAD AUTÓNOM
- Page 13 and 14:
A la vista de estos datos de la Red
- Page 15 and 16:
0,25 0,20 0,15 0,10 0,05 0,00 DENSI
- Page 17 and 18:
Carretera N-622: de Vitoria-Gasteiz
- Page 19 and 20:
√ P.K. 18 a 30; radios inferiores
- Page 21 and 22:
Carretera Red de Interés Preferent
- Page 23 and 24:
2.1.2.3. Velocidades específicas A
- Page 26 and 27:
2.1.2.4. Caídas de Velocidad La p
- Page 29 and 30:
2.1.3 Radios de Curvatura El trazad
- Page 31 and 32:
Radios de Curvatura del Territorio
- Page 33 and 34:
Radios de Curvatura del Territorio
- Page 38 and 39:
2.1.4 Sección transversal 2.1.4.1.
- Page 40 and 41:
NÚMERO DE CARRILES EN LAS CARRETER
- Page 42 and 43:
NÚMERO DE CARRILES EN LAS AUTOPIST
- Page 44 and 45:
NÚMERO DE CARRILES EN LAS CARRETER
- Page 47 and 48:
2.1.4.2. Anchos de plataforma El es
- Page 49 and 50:
Anchos de Plataforma del Territorio
- Page 51 and 52:
Finalmente, en la Red Comarcal de B
- Page 53 and 54:
ANCHOS DE PLATAFORMA EN LAS CARRETE
- Page 58 and 59:
2.1.5 Posibilidad de adelantamiento
- Page 60:
Tal y como se observa en la gráfic
- Page 63 and 64:
DISTRIBUCIÓN DEL TOTAL DE ACCIDENT
- Page 65 and 66:
LESIVIDAD EN LAS CARRETERAS DE LA R
- Page 67 and 68:
Territorio Histórico de Álava ACC
- Page 69 and 70:
Territorio Histórico de Bizkaia AC
- Page 71 and 72:
Tipo de accidente Absoluto 1999 200
- Page 73 and 74:
DISTRIBUCIÓN DE ACCIDENTES SEGÚN
- Page 75 and 76:
En el conjunto de las carreteras de
- Page 77 and 78:
ACCIDENTES CON VÍCTIMAS SEGÚN MES
- Page 79 and 80:
ACCIDENTES SEGÚN MES EN LAS CARRET
- Page 81 and 82:
Carretera Accidentes con Víctimas
- Page 83 and 84:
Carretera Accidentes con Víctimas
- Page 85 and 86:
Carretera Accidentes con Víctimas
- Page 87 and 88:
Carretera Accidentes con Víctimas
- Page 89 and 90:
Carretera Accidentes con Víctimas
- Page 91 and 92:
EVOLUCIÓN DEL NÚMERO DE ACCIDENTE
- Page 93 and 94:
2.1.6.8. Accidentes por kilómetro
- Page 95 and 96:
Carretera Accidentes con Víctimas
- Page 97 and 98:
ACCIDENTES CON VÍCTIMAS POR KILÓM
- Page 99 and 100:
ACCIDENTES POR KILÓMETRO EN LA RED
- Page 101 and 102:
AUTOPISTAS, AUTOVÍAS Y CARRETERAS
- Page 103 and 104:
DISTRIBUCIÓN DE TCA POR RANGOS DE
- Page 105:
TCA EN LAS CARRETERAS DE LA RED FUN
- Page 108 and 109:
INTERSECCIONES SEGÚN TIPOLOGÍA EN
- Page 111 and 112:
2.1.7.2. Red Funcional Además del
- Page 113 and 114:
INTERSECCIONES POR KILÓMETRO EN LA
- Page 115 and 116:
√ Número de semáforos. √ Núm
- Page 117 and 118:
TRAVESÍAS DE CONFLICTIVIDAD ALTA E
- Page 119 and 120:
TRAVESÍAS DE CONFLICTIVIDAD ALTA E
- Page 121:
La distribución de TCAs en traves
- Page 124 and 125:
A continuación se presenta la evol
- Page 126 and 127:
En la siguiente tabla se presentan
- Page 128 and 129:
Estación Carretera Tipo P.K. Local
- Page 130 and 131: Estación Carretera Tipo P.K. Local
- Page 132 and 133: Estación Carretera Tipo P.K. Local
- Page 134 and 135: Estación Carretera Tipo P.K. Local
- Page 136 and 137: Por su parte, aquellas carreteras d
- Page 138 and 139: 20.00% 18.00% 16.00% 14.00% 12.00%
- Page 140 and 141: INTENSIDAD DE PESADOS EN LA CARRETE
- Page 142 and 143: INTENSIDAD DE PESADOS EN LA CARRETE
- Page 144 and 145: PORCENTAJE DE PESADOS EN LA CARRETE
- Page 146 and 147: PORCENTAJE DE PESADOS EN LA CARRETE
- Page 148 and 149: El acceso al Aeropuerto de Loiu, en
- Page 150 and 151: Estación Carretera Tipo P.K. Local
- Page 152 and 153: Estación Carretera Tipo P.K. Local
- Page 154 and 155: Estación Carretera Tipo P.K. Local
- Page 156 and 157: Se presenta a continuación un grá
- Page 158 and 159: 4,500 4,000 3,500 3,000 2,500 2,000
- Page 160 and 161: INTENSIDAD DE TRÁFICO EN LA CARRET
- Page 162 and 163: INTENSIDAD DE TRÁFICO EN LA CARRET
- Page 164 and 165: INTENSIDAD DE TRÁFICO EN LA CARRET
- Page 166 and 167: 40.000 35.000 30.000 25.000 20.000
- Page 168 and 169: INTENSIDAD DE TRÁFICO EN LA CARRET
- Page 170 and 171: INTENSIDAD DE TRÁFICO EN LA CARRET
- Page 172 and 173: INTENSIDAD DE TRÁFICO EN LAS CARRE
- Page 174 and 175: INTENSIDAD DE TRÁFICO EN LAS CARRE
- Page 176 and 177: Estación Carretera Tipo P.K. Local
- Page 178 and 179: Estación Carretera Tipo P.K. Local
- Page 182 and 183: FLUJOS TOTALES DE TRÁFICO EN LA RE
- Page 184 and 185: Estación Carretera P.K. Localidad
- Page 186 and 187: Estación Carretera P.K. Localidad
- Page 188 and 189: Estación Carretera P.K. Localidad
- Page 190 and 191: De manera análoga al análisis ant
- Page 192 and 193: Estación Carretera P.K. Localidad
- Page 194 and 195: Estación Carretera P.K. Localidad
- Page 196 and 197: Estación Carretera P.K. Localidad
- Page 198 and 199: Por último, de la Red Comarcal las
- Page 200 and 201: Estación Carretera P.K. Localidad
- Page 202 and 203: Estación Carretera P.K. Localidad
- Page 204 and 205: Estación Carretera P.K. Localidad
- Page 206 and 207: Estación Carretera P.K. Localidad
- Page 208 and 209: Estación Carretera P.K. Localidad
- Page 210 and 211: Estación Carretera P.K. Localidad
- Page 212 and 213: 40,00% 35,00% 30,00% 25,00% 20,00%
- Page 214 and 215: 25,00% 20,00% 15,00% 10,00% TRÁFIC
- Page 216 and 217: 80,00% 70,00% 60,00% 50,00% 40,00%
- Page 218 and 219: 2.2.2.6. Evolución del Tráfico se
- Page 223 and 224: 2.2.3 Capacidad de la red y niveles
- Page 225 and 226: Cuando el tráfico no está formado
- Page 227 and 228: 2.2.3.2. Situación actual en la Re
- Page 229 and 230: Respecto al conjunto de la Comunida
- Page 231 and 232:
NIVEL DE SERVICIO EN EL TERRITORIO
- Page 234 and 235:
2.2.3.3. Resto de la Red Funcional
- Page 236 and 237:
2.3. CARACTERIZACIÓN DE LA MOVILID
- Page 238 and 239:
La cuota de reparto modal correspon
- Page 240 and 241:
2.3.1.2. Transporte de mercancías
- Page 242 and 243:
La cuota de reparto modal correspon
- Page 244 and 245:
2.3.2 Transporte por carretera 2.3.
- Page 246 and 247:
En el día medio del año 2003 la d
- Page 248 and 249:
Naturaleza del viaje TONELADAS TRAN
- Page 250 and 251:
Naturaleza del viaje EuskoTren Cer.
- Page 252 and 253:
√ Núcleo de Donostia-San Sebasti
- Page 254 and 255:
Naturaleza del viaje DEMANDA DE TRA
- Page 256 and 257:
2.4. LA MOVILIDAD EN LA RED FUNCION
- Page 258 and 259:
Origen Destino Itinerario Total Lig
- Page 260 and 261:
Origen Destino Itinerario Total Lig
- Page 262 and 263:
Origen Destino Itinerario Total Lig
- Page 264 and 265:
Origen Destino Itinerario Total Lig
- Page 266 and 267:
Por último, la matriz Origen / Des
- Page 268 and 269:
ESQUEMA METODOLÓGICO 276 Revisión
- Page 270 and 271:
PUNTOS DE CONTROL DE AFOROS. AÑO 2
- Page 272 and 273:
Origen Interno País Vasco Externo
- Page 274:
Zonificación Nombre Zona Zonificac
- Page 277 and 278:
√ Estratificación de la demanda
- Page 280:
2.5.6 Isocronas Con el fin de visua
- Page 289:
Las zonas que presentan mejor acces