2. análisis de la situación actual de la red viaria - Garraioak
2. análisis de la situación actual de la red viaria - Garraioak
2. análisis de la situación actual de la red viaria - Garraioak

You also want an ePaper? Increase the reach of your titles
YUMPU automatically turns print PDFs into web optimized ePapers that Google loves.
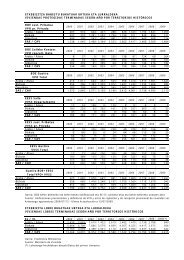
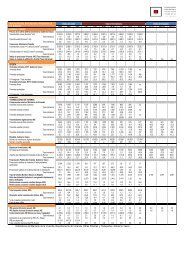
Gipuzkoa<br />
Carretera A B C D E F<br />
BI-630 0 100 0 0 0 0<br />
BI-631 3 41 42 0 14 0<br />
BI-633 0 0 0 47 53 0<br />
BI-635 0 0 0 0 100 0<br />
BI-636 0 58 42 0 0 0<br />
BI-637 17 11 31 40 0 0<br />
BI-638 0 0 0 0 100 0<br />
AP-1 100 0 0 0 0 0<br />
A-8 28 41 18 10 0 3<br />
A-15 100 0 0 0 0 0<br />
N-I 0 16 20 30 26 9<br />
N-121-A 0 0 0 100 0 0<br />
N-634 0 0 0 33 67 0<br />
N-636 22 0 9 23 46 0<br />
N-638 0 0 0 0 100 0<br />
GI-131 0 0 0 0 100 0<br />
GI-627 0 0 0 21 79 0<br />
GI-631 0 0 0 44 56 0<br />
GI-638 0 0 0 0 100 0<br />
Fuente: E<strong>la</strong>boración propia<br />
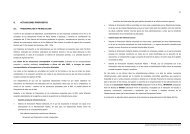
Es interesante completar el <strong>análisis</strong> con una revisión <strong>de</strong> los Niveles <strong>de</strong> Servicio que se alcanzan por tipo <strong>de</strong><br />
<strong>red</strong> y por Territorio Histórico. En los gráficos siguientes se muestra <strong>la</strong> distribución <strong>de</strong> porcentaje <strong>de</strong> longitud<br />
para dichos aspectos, habiéndose agregado los niveles <strong>de</strong> servicio en tres grupos: AB, que son los niveles <strong>de</strong><br />
mayor comodidad y flui<strong>de</strong>z <strong>de</strong> circu<strong>la</strong>ción; CD, como nivel intermedio, en los cuales si bien todavía <strong>la</strong><br />
circu<strong>la</strong>ción alcanza niveles <strong>de</strong> flui<strong>de</strong>z suficientes ya existen perturbaciones <strong>de</strong> velocidad y comodidad <strong>de</strong>bido<br />
al número <strong>de</strong> usuarios, con eventuales retenciones; y EF, como el resumen <strong>de</strong>l pero nivel <strong>de</strong> servicio, en que<br />
<strong>la</strong> circu<strong>la</strong>ción se aproxima o supera niveles cercanos a <strong>la</strong> congestión, con frecuentes interrupciones y pérdida<br />
<strong>de</strong> comodidad y velocidad.<br />
NIVEL DE SERVICIO EN EL TERRITORIO HISTÓRICO DE ÁLAVA<br />
70,00%<br />
60,00%<br />
50,00%<br />
40,00%<br />
30,00%<br />
20,00%<br />
10,00%<br />
0,00%<br />
69%<br />
(% KILÓMETROS POR TIPO DE RED)<br />
37%<br />
56%<br />
18%<br />
50%<br />
31%<br />
14% 13% 13%<br />
A+B C+D E+F<br />
R.I.P. R.B. R.O.P.<br />
Fuente: E<strong>la</strong>boración propia<br />
En el Territorio Histórico <strong>de</strong> Á<strong>la</strong>va, los niveles <strong>de</strong> servicio <strong>de</strong> mejores condiciones alcanzan un 56% <strong>de</strong>l total<br />
<strong>de</strong> longitud <strong>de</strong> <strong>la</strong>s carreteras, un 31% el nivel <strong>de</strong>finido como intermedio y un 13%, el menor <strong>de</strong> los tres<br />
Territorios, el nivel más <strong>de</strong>ficiente. Por tipo <strong>de</strong> Red, <strong>de</strong>staca que el 69% <strong>de</strong> <strong>la</strong> Red <strong>de</strong> Interés Preferente<br />
alcanza niveles A o B, mientras que en <strong>la</strong> Red Básica el mayor porcentaje se sitúa en el nivel intermedio. En<br />
ambos casos, el nivel más <strong>de</strong>ficiente obtiene <strong>la</strong>s menores cuotas, con un 14% en <strong>la</strong> Red <strong>de</strong> Interés<br />
Preferente y un 13% en <strong>la</strong> Red Básica.<br />
238<br />
Revisión <strong>de</strong>l Segundo P<strong>la</strong>n General <strong>de</strong> Carreteras <strong>de</strong>l País Vasco