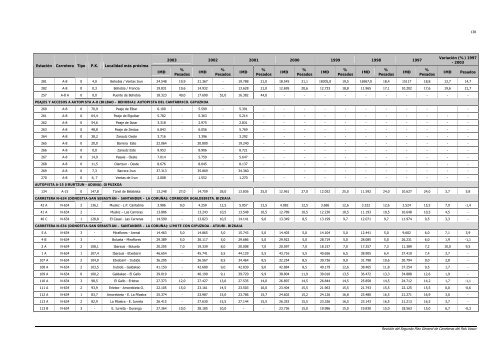
Estación Carretera Tipo P.K. Localidad más próxima IMD 2003 2002 2001 2000 1999 1998 1997 % Pesados IMD % Pesados IMD % Pesados IMD % Pesados IMD % Pesados IMD % Pesados IMD % Pesados 138 Variación (%) 1997 - 2003 IMD Pesados 281 A-8 0 4,0 Behobia / Ventas Irun 24.548 19,9 21.367 - 19.788 21,0 18.545 21,1 18305,0 19,5 16967,0 18,4 15117 18,8 13,7 14,7 282 A-8 0 0,3 Behobia / Francia 19.831 19,6 14.932 - 13.628 21,0 1<strong>2.</strong>695 20,6 1<strong>2.</strong>733 18,8 11.965 17,1 10.202 17,6 19,6 21,7 257 A-8 A 0 0,0 Puente <strong>de</strong> Behobia 18.323 49,0 17.690 52,0 16.382 44,0 - - - - - - - - - - PEAJES Y ACCESOS A AUTOPISTA A-8 (BILBAO – BEHOBIA): AUTOPISTA DEL CANTÁBRICO. GIPUZKOA 260 A-8 0 70,9 Peaje <strong>de</strong> Eibar 6.100 - 5.599 - 5.391 - - - - - - - - - - 261 A-8 0 64,4 Peaje <strong>de</strong> Elgoibar 5.782 - 5.363 - 5.214 - - - - - - - - - - - 262 A-8 0 54,6 Peaje <strong>de</strong> Itziar 3.318 - <strong>2.</strong>975 - <strong>2.</strong>831 - - - - - - - - - - - 263 A-8 0 48,8 Peaje <strong>de</strong> Zestoa 6.843 - 6.056 - 5.769 - - - - - - - - - - - 264 A-8 0 38,2 Zarautz Oeste 3.716 - 3.396 - 3.292 - - - - - - - - - - - 265 A-8 0 20,0 Barrera Este 2<strong>2.</strong>064 - 20.800 - 19.240 - - - - - - - - - - - 266 A-8 0 0,0 Zarautz Este 9.953 - 8.906 - 8.721 - - - - - - - - - - - 267 A-8 0 14,9 Pasaia - Oeste 7.014 - 5.759 - 5.647 - - - - - - - - - - - 268 A-8 0 11,5 Oiartzun - Oeste 8.676 - 8.045 - 8.137 - - - - - - - - - - - 269 A-8 0 7,3 Barrera Irun 37.313 - 35.869 - 34.360 - - - - - - - - - - 270 A-8 0 6, 7 Ventas <strong>de</strong> Irun <strong>2.</strong>008 - 1.552 - 1.270 - - - - - - - - - - - AUTOPISTA A-15 (IRURTZUN - ADUNA). GIPUZKOA 134 A-15 0 147,8 Túnel <strong>de</strong> Be<strong>la</strong>bieta 13.248 27,0 14.759 28,0 13.836 25,0 1<strong>2.</strong>961 27,0 1<strong>2.</strong>052 25,0 11.592 24,0 10.627 24,0 3,7 5,8 CARRETERA N-634 (DONOSTIA-SAN SEBASTIÁN – SANTANDER – LA CORUÑA): CORREDOR UGALDEBIETA. BIZKAIA 42 A N-634 2 136,1 Muskiz - L.P. Cantabria 3.986 9,0 4.259 12,5 5.057 12,5 4.082 12,5 3.686 12,6 3.322 12,6 <strong>2.</strong>524 15,5 7,9 -1,4 41 A N-634 2 - Muskiz – Las Carreras 13.886 - 13.243 10,5 13.548 10,5 1<strong>2.</strong>789 10,5 1<strong>2.</strong>230 10,5 11.193 10,5 10.648 10,5 4,5 - 40 C N-634 1 128,8 El Casal - Las Carreras 14.590 - 13.823 10,5 14.141 9,6 13.349 8,5 13.199 9,7 1<strong>2.</strong>071 9,7 11.974 9,5 3,3 - CARRETERA N-634 (DONOSTIA-SAN SEBASTIÁN – SANTANDER – LA CORUÑA): LÍMITE CON GIPUZKOA - ATXURI. BIZKAIA 5 A N-634 3 - Miraflores - Arenal 14.463 5,0 14.865 5,0 15.743 5,0 14.403 5,0 14.104 5,0 1<strong>2.</strong>441 5,0 9.602 6,0 7,1 3,9 4 B N-634 3 - Bolueta - Miraflores 29.389 5,0 30.117 5,0 29.686 5,0 29.922 5,0 28.719 5,0 28.085 5,0 26.231 6,0 1,9 -1,1 2 A N-634 2 108,1 Ibarsusi - Bolueta 20.205 7,0 19.339 8,0 20.008 7,0 20.597 7,0 18.157 7,0 17.257 7,3 11.389 7,2 10,0 9,5 1 A N-634 1 107,4 Ibarsusi - Etxebarri 46.654 - 45.741 5,5 44.129 5,5 43.716 5,5 40.656 6,5 38.905 6,4 37.410 7,4 3,7 - 107 A N-634 2 104,0 Etxebarri - Irubi<strong>de</strong> 36.295 - 36.567 8,5 34.464 8,5 3<strong>2.</strong>254 8,5 30.726 9,0 31.798 10,6 30.794 9,0 2,8 - 108 A N-634 2 103,5 Irubi<strong>de</strong> - Galdakao 41.150 - 4<strong>2.</strong>680 9,0 4<strong>2.</strong>839 9,0 4<strong>2.</strong>884 8,5 40.179 12,6 38.465 11,8 37.254 9,5 1,7 - 109 A N-634 0 100,2 Galdakao - El Gallo 39.019 - 40.190 9,1 39.720 9,9 38.804 11,9 39.010 13,5 36.472 13,3 34.888 12,6 1,9 - 110 A N-634 3 98,5 El Gallo - Erletxe 27.373 12,0 27.427 13,0 27.535 14,0 26.897 14,5 26.844 14,5 25.858 14,5 24.712 14,2 1,7 -1,1 111 A N-634 2 93,9 Erletxe - Amorebieta O. 2<strong>2.</strong>105 15,0 23.161 14,5 23.503 16,0 23.404 15,5 21.963 15,5 21.743 15,5 2<strong>2.</strong>125 15,5 0,0 -0,6 112 A N-634 1 83,7 Amorebieta - E. La Pi<strong>la</strong>stra 25.374 - 23.987 15,0 23.786 15,7 24.602 15,2 24.126 16,8 23.480 16,5 21.271 16,9 3,0 - 113 A N-634 2 82,9 La Pi<strong>la</strong>stra - E. Iurreta 26.415 - 27.630 15,5 27.144 15,5 26.353 15,5 23.326 16,5 23.143 16,5 21.213 16,5 3,7 - 113 B N-634 3 - E. Iurreta - Durango 27.364 10,0 28.185 10,0 - - 23.736 15,0 19.986 15,0 19.830 15,0 18.563 15,0 6,7 -0,3 Revisión <strong>de</strong>l Segundo P<strong>la</strong>n General <strong>de</strong> Carreteras <strong>de</strong>l País Vasco
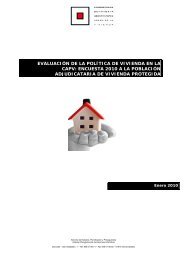
Estación Carretera Tipo P.K. Localidad más próxima IMD 2003 2002 2001 2000 1999 1998 1997 % Pesados IMD % Pesados IMD % Pesados IMD % Pesados IMD % Pesados IMD % Pesados IMD % Pesados 139 Variación (%) 1997 - 2003 IMD Pesados 114 A N-634 2 79,2 Durango - Matiena 21.141 - 20.546 10,5 - - 21.663 15,5 20.292 16,5 21.216 17,5 19.861 19,0 1,0 - 115 A N-634 3 - Matiena - O<strong>la</strong>kueta 1<strong>2.</strong>452 11,0 1<strong>2.</strong>876 11,0 - - 1<strong>2.</strong>986 10,5 1<strong>2.</strong>657 10,0 1<strong>2.</strong>732 15,0 13.171 15,0 -0,9 -5,9 115 D N-634 1 73,6 O<strong>la</strong>kueta - Zaldibar 9.985 11,0 10.066 12,0 - - 9.452 13,0 10.234 9,3 9.717 16,6 10.190 14,2 -0,3 -4,5 116 A N-634 0 70,1 Zaldibar - Areitio 7.220 - 7.368 14,8 - - 7.493 13,9 7.516 14,4 7.372 15,9 7.418 14,3 -0,4 - 117 A N-634 3 - Areitio - Ermua 7.754 14,0 7.963 14,0 - - 8.001 14,0 7.913 14,0 8.165 17,0 8.201 13,5 -0,9 -0,3 117 D N-634 1 65,7 Ermua - L.P. Gipuzkoa 17.109 - 16.312 7,0 - - 16.274 8,0 16.593 7,0 17.794 8,3 18.381 9,0 -1,2 - CARRETERA N-634 (DONOSTIA-SAN SEBASTIÁN – SANTANDER – A CORUÑA): DONOSTIA-SAN SEBASTIÁN - LÍMITE CON BIZKAIA. GIPUZKOA 47 N-634 3 66,0 Eibar (Muga) 17.789 13,5 18.659 - 18.289 - 19.524 - 20.727 - 21.536 - 20.208 - -2,1 - 11 N-634 1 61,5 Eibar 19.083 12,9 20.300 14,0 18.779 14,0 19.240 15,0 19.839 15,0 17.137 15,0 18.307 10,7 0,7 3,9 106 N-634 3 59,9 Puente bajo autopista 17.506 12,0 18.122 - 18.649 - 18.385 - 18.308 - 18.269 - 15.481 - 2,1 - 46 N-634 3 57,9 Sigma (Elgoibar) 17.391 12,0 19.335 - 20.131 - 20.852 - 20.557 - 19.968 - 15.698 - 1,7 - 45 N-634 2 54,4 Salida <strong>de</strong> Altzo<strong>la</strong> 9.866 11,0 10.548 11,0 10.019 11,0 10.212 12,0 9.229 10,0 8.930 11,0 9.112 9,2 1,3 - 43 N-634 3 45,4 Deba 6.101 12,0 6.408 - 6.022 - 5.975 - 6.470 - 4.941 - 5.707 - 1,1 - 41 N-634 3 34,4 Itziar (Chatarreria) 3.928 12,0 4.312 - 4.005 - 4.212 - 4.872 - 4.604 - 4.419 - -1,9 - 105 N-634 3 31,1 Cruce <strong>de</strong> Iraeta 5.369 13,0 5.476 - 5.099 - 5.389 - 5.154 - 6.094 - 5.331 - 0,1 - 55 N-634 0 29,9 Arrona 10.176 14,0 10.131 14,0 10.042 14,0 9.853 15,0 9.711 15,0 9.536 16,0 9.094 14,1 1,9 1,8 123 N-634 3 29,6 Salida hacía Okina 11.416 14,0 11.724 - 11.616 - 10.039 - 1<strong>2.</strong>499 - 9.573 - 11.252 - 0,2 - 40 N-634 1 24,7 Getaria 6.265 12,0 7.192 12,0 6.850 13,0 6.448 15,0 6.987 14,0 7.895 - 7.128 - -2,1 - 122 N-634 3 21,4 Getaria - Casa Caminer 8.362 12,0 9.469 - 8.247 - 8.969 - 9.602 - 7.905 - 9.217 - -1,6 - 37 N-634 3 7,6 Aginaga 9.909 11,0 10.979 - 10.752 - 10.480 - 9.680 - 1<strong>2.</strong>559 - 1<strong>2.</strong>023 - -3,2 - 104 N-634 3 1,5 Cruce Txikierdi 23.053 11,0 2<strong>2.</strong>375 - 2<strong>2.</strong>700 - 21.560 - 19.119 - 2<strong>2.</strong>085 - 18.341 - 3,9 - CARRETERA N-240 (DE TARRAGONA A BILBAO POR EL PUERTO DE BARAZAR): VITORIA-GASTEIZ - LÍMITE CON BIZKAIA. ÁLAVA 61 N-240 3 4,9 Gamarra Mayor 2<strong>2.</strong>801 13,9 2<strong>2.</strong>801 13,9 2<strong>2.</strong>946 14,9 24.072 16,3 2<strong>2.</strong>658 17,5 17.489 16,7 19.649 15,61 2,5 0,5 110 N-240 0 6,3 Durana 26.060 11,6 - - 24.753 14,9 25.776 16,3 24.426 17,3 24.046 16,7 21.766 15,62 3,0 -1,9 111 N-240 3 15,0 Legutiano 11.047 17,6 13.038 17,5 1<strong>2.</strong>713 14,9 10.791 16,3 10.525 17,3 10.030 16,7 - - - - 302 N-240 - 20,0 Ollerías 4.301 32,2 - - - - 4.881 42,6 - - - - 7.720 - -9,3 - 300 N-240 1 21,5 Ubi<strong>de</strong>a 3.929 36,7 4.230 38,7 3.927 42,3 4.807 42,4 5.496 40,3 5.732 40,2 5.200 39,77 -4,6 -5,9 CARRETERA N-240 (DE TARRAGONA A BILBAO POR EL PUERTO DE BARAZAR): LÍMTE CON ÁLAVA – GALDAKAO (EL GALLO). CORREDOR DEL ARRATIA (BARAZAR). BIZKAIA 169 B N-240 1 40,5 Zubizabal - L.P. (Ubi<strong>de</strong>a) 4.184 40,0 4.295 41,6 4.351 41,6 4.542 44,8 5.338 43,2 4.931 40,0 5.190 41,0 -3,5 -3,9 169 A N-240 3 - Barazar - Zubizabal 4.335 38,5 4.449 39,5 4.539 40,8 4.707 44,0 5.533 42,3 5.363 40,0 5.454 40,0 -3,8 -4,4 168 C N-240 3 - Zeanuri - Barazar 4.738 35,5 5.029 36,5 5.139 37,5 5.118 41,0 5.951 39,8 5.692 40,0 5.618 40,0 -2,8 -4,7 168 A N-240 3 - Int. BI-3530 - Zeanuri 5.624 30,5 5.906 30,0 5.987 30,0 6.185 33,5 6.961 34,7 6.630 34,3 7.002 34,0 -3,6 -5,3 166 B N-240 3 - Int. BI-3530 - Zeanuri 5.967 30,0 6.126 32,0 6.740 33,0 6.650 33,0 7.309 34,0 6.995 33,0 7.387 35,0 -3,5 -5,9 166 A N-240 3 - Arantzazu - Bildoso<strong>la</strong> (BI- 3530) 8.776 26,0 9.025 26,0 8.711 28,0 8.606 30,0 9.468 31,0 9.171 31,0 9.019 34,0 -0,5 -4,8 Revisión <strong>de</strong>l Segundo P<strong>la</strong>n General <strong>de</strong> Carreteras <strong>de</strong>l País Vasco
- Page 1 and 2:
2. ANÁLISIS DE LA SITUACIÓN ACTUA
- Page 3 and 4:
DISTRIBUCIÓN DE LA LONGITUD DE CAR
- Page 5 and 6:
En lo que se refiere a la Red de In
- Page 7 and 8:
DISTRIBUCIÓN DE LA RED BÁSICA SEG
- Page 9 and 10:
2,0 1,8 1,6 1,4 1,2 1,0 0,8 0,6 0,4
- Page 11 and 12:
RED OBJETO DE LA COMUNIDAD AUTÓNOM
- Page 13 and 14:
A la vista de estos datos de la Red
- Page 15 and 16:
0,25 0,20 0,15 0,10 0,05 0,00 DENSI
- Page 17 and 18:
Carretera N-622: de Vitoria-Gasteiz
- Page 19 and 20:
√ P.K. 18 a 30; radios inferiores
- Page 21 and 22:
Carretera Red de Interés Preferent
- Page 23 and 24:
2.1.2.3. Velocidades específicas A
- Page 26 and 27:
2.1.2.4. Caídas de Velocidad La p
- Page 29 and 30:
2.1.3 Radios de Curvatura El trazad
- Page 31 and 32:
Radios de Curvatura del Territorio
- Page 33 and 34:
Radios de Curvatura del Territorio
- Page 38 and 39:
2.1.4 Sección transversal 2.1.4.1.
- Page 40 and 41:
NÚMERO DE CARRILES EN LAS CARRETER
- Page 42 and 43:
NÚMERO DE CARRILES EN LAS AUTOPIST
- Page 44 and 45:
NÚMERO DE CARRILES EN LAS CARRETER
- Page 47 and 48:
2.1.4.2. Anchos de plataforma El es
- Page 49 and 50:
Anchos de Plataforma del Territorio
- Page 51 and 52:
Finalmente, en la Red Comarcal de B
- Page 53 and 54:
ANCHOS DE PLATAFORMA EN LAS CARRETE
- Page 58 and 59:
2.1.5 Posibilidad de adelantamiento
- Page 60:
Tal y como se observa en la gráfic
- Page 63 and 64:
DISTRIBUCIÓN DEL TOTAL DE ACCIDENT
- Page 65 and 66:
LESIVIDAD EN LAS CARRETERAS DE LA R
- Page 67 and 68:
Territorio Histórico de Álava ACC
- Page 69 and 70:
Territorio Histórico de Bizkaia AC
- Page 71 and 72:
Tipo de accidente Absoluto 1999 200
- Page 73 and 74:
DISTRIBUCIÓN DE ACCIDENTES SEGÚN
- Page 75 and 76:
En el conjunto de las carreteras de
- Page 77 and 78:
ACCIDENTES CON VÍCTIMAS SEGÚN MES
- Page 79 and 80: ACCIDENTES SEGÚN MES EN LAS CARRET
- Page 81 and 82: Carretera Accidentes con Víctimas
- Page 83 and 84: Carretera Accidentes con Víctimas
- Page 85 and 86: Carretera Accidentes con Víctimas
- Page 87 and 88: Carretera Accidentes con Víctimas
- Page 89 and 90: Carretera Accidentes con Víctimas
- Page 91 and 92: EVOLUCIÓN DEL NÚMERO DE ACCIDENTE
- Page 93 and 94: 2.1.6.8. Accidentes por kilómetro
- Page 95 and 96: Carretera Accidentes con Víctimas
- Page 97 and 98: ACCIDENTES CON VÍCTIMAS POR KILÓM
- Page 99 and 100: ACCIDENTES POR KILÓMETRO EN LA RED
- Page 101 and 102: AUTOPISTAS, AUTOVÍAS Y CARRETERAS
- Page 103 and 104: DISTRIBUCIÓN DE TCA POR RANGOS DE
- Page 105: TCA EN LAS CARRETERAS DE LA RED FUN
- Page 108 and 109: INTERSECCIONES SEGÚN TIPOLOGÍA EN
- Page 111 and 112: 2.1.7.2. Red Funcional Además del
- Page 113 and 114: INTERSECCIONES POR KILÓMETRO EN LA
- Page 115 and 116: √ Número de semáforos. √ Núm
- Page 117 and 118: TRAVESÍAS DE CONFLICTIVIDAD ALTA E
- Page 119 and 120: TRAVESÍAS DE CONFLICTIVIDAD ALTA E
- Page 121: La distribución de TCAs en traves
- Page 124 and 125: A continuación se presenta la evol
- Page 126 and 127: En la siguiente tabla se presentan
- Page 128 and 129: Estación Carretera Tipo P.K. Local
- Page 132 and 133: Estación Carretera Tipo P.K. Local
- Page 134 and 135: Estación Carretera Tipo P.K. Local
- Page 136 and 137: Por su parte, aquellas carreteras d
- Page 138 and 139: 20.00% 18.00% 16.00% 14.00% 12.00%
- Page 140 and 141: INTENSIDAD DE PESADOS EN LA CARRETE
- Page 142 and 143: INTENSIDAD DE PESADOS EN LA CARRETE
- Page 144 and 145: PORCENTAJE DE PESADOS EN LA CARRETE
- Page 146 and 147: PORCENTAJE DE PESADOS EN LA CARRETE
- Page 148 and 149: El acceso al Aeropuerto de Loiu, en
- Page 150 and 151: Estación Carretera Tipo P.K. Local
- Page 152 and 153: Estación Carretera Tipo P.K. Local
- Page 154 and 155: Estación Carretera Tipo P.K. Local
- Page 156 and 157: Se presenta a continuación un grá
- Page 158 and 159: 4,500 4,000 3,500 3,000 2,500 2,000
- Page 160 and 161: INTENSIDAD DE TRÁFICO EN LA CARRET
- Page 162 and 163: INTENSIDAD DE TRÁFICO EN LA CARRET
- Page 164 and 165: INTENSIDAD DE TRÁFICO EN LA CARRET
- Page 166 and 167: 40.000 35.000 30.000 25.000 20.000
- Page 168 and 169: INTENSIDAD DE TRÁFICO EN LA CARRET
- Page 170 and 171: INTENSIDAD DE TRÁFICO EN LA CARRET
- Page 172 and 173: INTENSIDAD DE TRÁFICO EN LAS CARRE
- Page 174 and 175: INTENSIDAD DE TRÁFICO EN LAS CARRE
- Page 176 and 177: Estación Carretera Tipo P.K. Local
- Page 178 and 179: Estación Carretera Tipo P.K. Local
- Page 180 and 181:
Estación Carretera Tipo P.K. Local
- Page 182 and 183:
FLUJOS TOTALES DE TRÁFICO EN LA RE
- Page 184 and 185:
Estación Carretera P.K. Localidad
- Page 186 and 187:
Estación Carretera P.K. Localidad
- Page 188 and 189:
Estación Carretera P.K. Localidad
- Page 190 and 191:
De manera análoga al análisis ant
- Page 192 and 193:
Estación Carretera P.K. Localidad
- Page 194 and 195:
Estación Carretera P.K. Localidad
- Page 196 and 197:
Estación Carretera P.K. Localidad
- Page 198 and 199:
Por último, de la Red Comarcal las
- Page 200 and 201:
Estación Carretera P.K. Localidad
- Page 202 and 203:
Estación Carretera P.K. Localidad
- Page 204 and 205:
Estación Carretera P.K. Localidad
- Page 206 and 207:
Estación Carretera P.K. Localidad
- Page 208 and 209:
Estación Carretera P.K. Localidad
- Page 210 and 211:
Estación Carretera P.K. Localidad
- Page 212 and 213:
40,00% 35,00% 30,00% 25,00% 20,00%
- Page 214 and 215:
25,00% 20,00% 15,00% 10,00% TRÁFIC
- Page 216 and 217:
80,00% 70,00% 60,00% 50,00% 40,00%
- Page 218 and 219:
2.2.2.6. Evolución del Tráfico se
- Page 223 and 224:
2.2.3 Capacidad de la red y niveles
- Page 225 and 226:
Cuando el tráfico no está formado
- Page 227 and 228:
2.2.3.2. Situación actual en la Re
- Page 229 and 230:
Respecto al conjunto de la Comunida
- Page 231 and 232:
NIVEL DE SERVICIO EN EL TERRITORIO
- Page 234 and 235:
2.2.3.3. Resto de la Red Funcional
- Page 236 and 237:
2.3. CARACTERIZACIÓN DE LA MOVILID
- Page 238 and 239:
La cuota de reparto modal correspon
- Page 240 and 241:
2.3.1.2. Transporte de mercancías
- Page 242 and 243:
La cuota de reparto modal correspon
- Page 244 and 245:
2.3.2 Transporte por carretera 2.3.
- Page 246 and 247:
En el día medio del año 2003 la d
- Page 248 and 249:
Naturaleza del viaje TONELADAS TRAN
- Page 250 and 251:
Naturaleza del viaje EuskoTren Cer.
- Page 252 and 253:
√ Núcleo de Donostia-San Sebasti
- Page 254 and 255:
Naturaleza del viaje DEMANDA DE TRA
- Page 256 and 257:
2.4. LA MOVILIDAD EN LA RED FUNCION
- Page 258 and 259:
Origen Destino Itinerario Total Lig
- Page 260 and 261:
Origen Destino Itinerario Total Lig
- Page 262 and 263:
Origen Destino Itinerario Total Lig
- Page 264 and 265:
Origen Destino Itinerario Total Lig
- Page 266 and 267:
Por último, la matriz Origen / Des
- Page 268 and 269:
ESQUEMA METODOLÓGICO 276 Revisión
- Page 270 and 271:
PUNTOS DE CONTROL DE AFOROS. AÑO 2
- Page 272 and 273:
Origen Interno País Vasco Externo
- Page 274:
Zonificación Nombre Zona Zonificac
- Page 277 and 278:
√ Estratificación de la demanda
- Page 280:
2.5.6 Isocronas Con el fin de visua
- Page 289:
Las zonas que presentan mejor acces