2. análisis de la situación actual de la red viaria - Garraioak
2. análisis de la situación actual de la red viaria - Garraioak
2. análisis de la situación actual de la red viaria - Garraioak

Create successful ePaper yourself
Turn your PDF publications into a flip-book with our unique Google optimized e-Paper software.
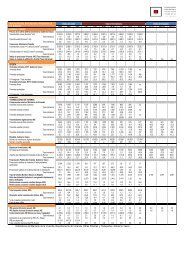
Naturaleza <strong>de</strong>l viaje<br />
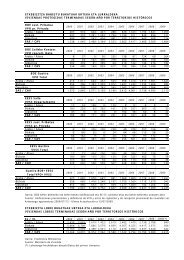
DEMANDA DE TRANSPORTE DE VIAJEROS POR CARRETERA EN LA CAPV 6<br />
Año 1995 Año 2001 Año 2002 Año 2003<br />
V. Ligero Autobús Total V. Ligero Autobús Total V. Ligero Autobús Total V. Ligero Autobús Total<br />
Viajeros % Viajeros % Viajeros % Viajeros % Viajeros % Viajeros % Viajeros % Viajeros % Viajeros % Viajeros % Viajeros % Viajeros %<br />
Viajes Internos 246.917 65,5 169.672 90,1 416.589 73,7 289.296 62,3 181.299 94,2 611.977 76,7 294.678 61,3 181.299 94,2 475.977 70,7 301.362 60,2 178.195 93,7 479.557 69,4<br />
Viajes O/D País Vasco<br />
(nacional)<br />
Viajes O/D País Vasco<br />
(internacional)<br />
84.442 22,4 114.653 24,7 11.192 5,8 125.845 15,8 12<strong>2.</strong>582 25,5 13<strong>2.</strong>592 26,5<br />
38.346 10,2<br />
18.283 9,7 141.071 25,0<br />
50.271 10,8 - - 50.271 6,3 5<strong>2.</strong>957 11,0<br />
11.192 5,8 186.731 27,2<br />
55.083 11,0<br />
11.907 6,3 199.582 28,9<br />
Viajes <strong>de</strong> Tránsito 7.329 1,9 413 0,2 7.742 1,4 10.173 2,2 - - 10.173 1,3 10.810 2,2 - - 10.810 1,6 11.537 2,3 - - 11.537 1,7<br />
Total 377.034 100,0 188.368 100,0 565.402 100,0 464.393 100,0 19<strong>2.</strong>491 100,0 798.266 100,0 481.027 100,0 19<strong>2.</strong>491 100,0 673.518 100,0 500.574 100,0 190.102 100,0 690.676 100,0<br />
Naturaleza <strong>de</strong>l viaje<br />
Fuente: E<strong>la</strong>boración propia a partir <strong>de</strong> <strong>la</strong> Imagen Final <strong>de</strong> <strong>la</strong> Demanda 1995, 2001 y <strong>actual</strong>ización 2002 y 2003.<br />
Ocupación<br />
REPARTO MODAL (%) EN EL TRANSPORTE POR CARRETERA<br />
Año 1995 Año 2001 Año 2002 7 Año 2003<br />
V. Ligero Autobús V. Ligero Autobús V. Ligero Autobús V. Ligero Autobús<br />
Reparto<br />
Modal<br />
Reparto<br />
Modal<br />
Ocupación<br />
Reparto<br />
Modal<br />
Reparto<br />
Modal<br />
Reparto<br />
Modal<br />
Reparto<br />
Modal<br />
Reparto<br />
Modal<br />
Viajes Internos 1,43 59,3 40,7 1,29 61,5 38,5 61,9 38,1 62,8 37,2<br />
Viajes O/D País Vasco (nacional) 1,64 1,39<br />
87,0 13,0<br />
Viajes O/D País Vasco (internacional) 1,56<br />
1,54<br />
Reparto<br />
Modal<br />
93,6 3,4 94,0 6,0 94,0 6,0<br />
Viajes <strong>de</strong> Tránsito 1,95 94,7 5,3 1,89 100,0 0,0 100,0 0,0 100,0 0,0<br />
Total viajes 1,49 66,7 33,3 1,35 70,7 29,3 71,4 28,6 72,5 27,5<br />
Fuente: E<strong>la</strong>boración propia a partir <strong>de</strong> <strong>la</strong> Imagen Final <strong>de</strong> <strong>la</strong> Demanda 1995, 2001 y <strong>actual</strong>ización 2002 y 2003.<br />
6 En el año 1995 se consi<strong>de</strong>ra el número <strong>de</strong> personas que viajan en el día medio <strong>la</strong>borable, mientras que en los años 2001, 2002 y 2003 es en el día medio anual.<br />
7 En los años 2002 y 2003 no se dispone <strong>de</strong> datos <strong>de</strong> ocupación <strong>de</strong> vehículo privado.<br />
253<br />
Revisión <strong>de</strong>l Segundo P<strong>la</strong>n General <strong>de</strong> Carreteras <strong>de</strong>l País Vasco