2. análisis de la situación actual de la red viaria - Garraioak
2. análisis de la situación actual de la red viaria - Garraioak
2. análisis de la situación actual de la red viaria - Garraioak

Create successful ePaper yourself
Turn your PDF publications into a flip-book with our unique Google optimized e-Paper software.
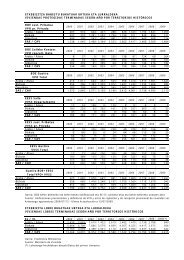
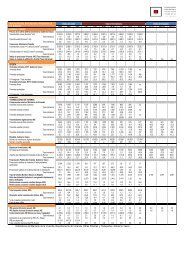
A continuación se presenta una tab<strong>la</strong> resumen <strong>de</strong> los tipos <strong>de</strong> acci<strong>de</strong>ntes que han tenido lugar en el período<br />
1999 – 2003 en <strong>la</strong>s carreteras <strong>de</strong> <strong>la</strong> Red Funcional <strong>de</strong> los tres Territorios Históricos.<br />
RESUMEN DE LA ACCIDENTALIDAD SEGÚN TIPO EN LAS CARRETERAS DE LA RED FUNCIONAL 1<br />
PERÍODO 1999 - 2003<br />
Tipo <strong>de</strong> acci<strong>de</strong>nte<br />
1999 2000 2001 2002 2003<br />
Absoluto % Absoluto % Absoluto % Absoluto % Absoluto %<br />
Á<strong>la</strong>va<br />
Colisión <strong>de</strong> vehículos 110 34,4 136 38,7 150 38,2 162 34,6 153 32,2<br />
Colisión <strong>de</strong> vehículo –<br />
obstáculo 15 4,7 7 2,0 7 1,8 20 4,3 17 3,6<br />
Atropello 12 3,8 11 3,1 8 2,0 7 1,5 7 1,5<br />
Vuelco en Calzada 5 1,6 10 2,8 3 0,8 7 1,5 5 1,1<br />
Salida <strong>de</strong> <strong>la</strong> calzada <strong>de</strong>recha 69 21,6 80 22,8 95 24,2 116 24,8 125 26,3<br />
Salida <strong>de</strong> <strong>la</strong> calzada<br />
izquierda 94 29,4 93 26,5 114 29,0 139 29,7 150 31,6<br />
Otros 15 4,7 14 4,0 16 4,1 17 3,6 18 3,8<br />
Bizkaia<br />
Colisión <strong>de</strong> vehículos 608 58,9 769 56,7 797 53,7 815 56,0 879 56,1<br />
Colisión <strong>de</strong> vehículo –<br />
obstáculo 49 4,7 83 6,1 137 9,2 64 4,4 71 4,5<br />
Atropello 43 4,2 29 2,1 36 2,4 41 2,8 45 2,9<br />
Vuelco en Calzada 19 1,8 33 2,4 23 1,5 23 1,6 24 1,5<br />
Salida <strong>de</strong> <strong>la</strong> calzada <strong>de</strong>recha 119 11,5 191 14,1 161 10,8 195 13,4 234 14,9<br />
Salida <strong>de</strong> <strong>la</strong> calzada<br />
izquierda 158 15,3 205 15,1 268 18,0 260 17,9 234 14,9<br />
Otros 36 3,5 46 3,4 63 4,2 57 3,9 81 5,2<br />
Gipuzkoa<br />
Colisión <strong>de</strong> vehículos 236 47,8 230 47,7 591 48,5 525 46,7 456 45,2<br />
Colisión <strong>de</strong> vehículo –<br />
obstáculo 10 2,0 9 1,9 42 3,4 48 4,3 51 5,1<br />
Atropello 38 7,7 33 6,8 32 2,6 44 3,9 28 2,8<br />
Vuelco en Calzada 14 2,8 12 2,5 38 3,1 31 2,8 40 4,0<br />
Salida <strong>de</strong> <strong>la</strong> calzada <strong>de</strong>recha 60 12,1 71 14,7 189 15,5 175 15,6 159 15,8<br />
Salida <strong>de</strong> <strong>la</strong> calzada<br />
izquierda 99 20,0 106 22,0 256 21,0 227 20,2 223 22,1<br />
Otros 37 7,5 21 4,4 70 5,7 74 6,6 52 5,2<br />
Fuente: E<strong>la</strong>boración propia a partir <strong>de</strong> datos <strong>de</strong> <strong>la</strong> Dirección General <strong>de</strong> Tráfico.<br />
<strong>2.</strong>1.6.4. Luminosidad<br />
La distribución <strong>de</strong> los acci<strong>de</strong>ntes con víctimas entre el período diurno y nocturno es <strong>la</strong> que se muestra en <strong>la</strong><br />
tab<strong>la</strong> adjunta. Entendiendo como “Día” <strong>la</strong>s situaciones <strong>de</strong> pleno día o crepúsculo; y entendiendo como<br />
“Noche” los periodos <strong>de</strong> luminosidad insuficiente, iluminación insuficiente o carencia <strong>de</strong> iluminación.<br />
ACCIDENTALIDAD SEGÚN LA LUMINOSIDAD EXISTENTE EN LAS CARRETERAS DE LA RED<br />
FUNCIONAL<br />
PERÍODO 1999 - 2003<br />
Luminosidad<br />
1999 2000 2001 2002 2003<br />
Absoluto % Absoluto % Absoluto % Absoluto % Absoluto %<br />
Á<strong>la</strong>va<br />
Día 225 70,3 248 71,3 273 69,5 327 69,9 346 72,8<br />
Noche<br />
Bizkaia<br />
95 29,7 100 28,7 120 30,5 141 30,1 129 27,2<br />
Día 702 68,0 866 66,1 1.007 67,8 1.016 69,8 1.105 68,3<br />
Noche 330 32,0 444 33,9 478 32,2 439 30,2 514 31,7<br />
Gipuzkoa<br />
Día 327 66,2 293 60,9 883 72,5 796 70,8 713 70,7<br />
Noche 167 33,8 189 39,2 335 27,5 328 29,2 296 29,3<br />
CAPV<br />
Día 1.254 67,9 1.407 65,7 <strong>2.</strong>163 69,9 <strong>2.</strong>139 70,2 <strong>2.</strong>164 69,7<br />
Noche 592 32,1 733 34,3 933 30,1 908 29,8 939 30,3<br />
Fuente: E<strong>la</strong>boración propia a partir <strong>de</strong> datos <strong>de</strong> <strong>la</strong> Dirección General <strong>de</strong> Tráfico.<br />
En los tres Territorios Históricos y a lo <strong>la</strong>rgo <strong>de</strong> los cinco años <strong>de</strong>l período <strong>de</strong> <strong>análisis</strong> (1999 – 2003), el<br />
porcentaje <strong>de</strong> acci<strong>de</strong>ntes con víctimas en el período diurno es mayor que el <strong>de</strong>l período nocturno. Este<br />
porcentaje <strong>de</strong> acci<strong>de</strong>ntes se ha mantenido prácticamente constante en Á<strong>la</strong>va y Bizkaia, no así en Gipuzkoa<br />
don<strong>de</strong> en el año 2000 se produjo un <strong>de</strong>crecimiento <strong>de</strong> los acci<strong>de</strong>ntes diurnos, para al año siguiente crecer y<br />
ser el 2001 el año que ha registrado el mayor porcentaje <strong>de</strong> acci<strong>de</strong>ntes durante el día en este Territorio<br />
Histórico.<br />
80<br />
Revisión <strong>de</strong>l Segundo P<strong>la</strong>n General <strong>de</strong> Carreteras <strong>de</strong>l País Vasco