2. análisis de la situación actual de la red viaria - Garraioak
2. análisis de la situación actual de la red viaria - Garraioak
2. análisis de la situación actual de la red viaria - Garraioak

You also want an ePaper? Increase the reach of your titles
YUMPU automatically turns print PDFs into web optimized ePapers that Google loves.
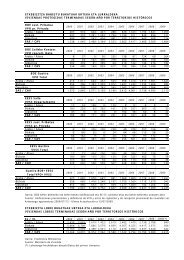
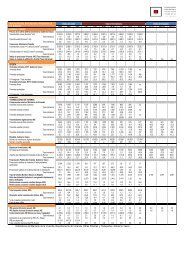
MOVILIDAD SEGÚN TIPOLOGÍA DE VIAJE<br />
Naturaleza <strong>de</strong>l<br />
Tn / día <strong>la</strong>borable medio (año 1995) Tn / día medio (año 2001) Tn / día medio (año 2002) Tn / día medio (año 2003)<br />
viaje<br />
Carretera Ferrocarril Aéreo Marítimo Total Carretera Ferrocarril Aéreo Marítimo Total Carretera Ferrocarril Aéreo Marítimo Total Carretera Ferrocarril Aéreo Marítimo Total<br />
Viajes Internos 104.028 <strong>2.</strong>515 0 551 107.094 140.979 1.349 0 0 14<strong>2.</strong>328 143.145 1.648 0 0 144.793 146.111 1.299 0 0 147.410<br />
Viajes Originados 137.443 9.882 47 79.802 227.174 213.458 10.964 110 86.967 311.499 231.036 11.799 128 85.783 328.746 246.100 11.805 121 95.076 353.102<br />
Viajes <strong>de</strong> Tránsito 44.887 1.600 0 0 46.487 70.236 <strong>2.</strong>532 0 0 7<strong>2.</strong>768 75.933 4.081 0 0 80.014 80.780 4.426 0 0 85.206<br />
Total 286.358 13.997 47 80.353 380.755 424.673 14.845 110 86.967 526.595 450.114 17.528 128 85.783 553.553 47<strong>2.</strong>991 17.530 121 95.076 585.718<br />
Naturaleza <strong>de</strong>l<br />
viaje<br />
Fuente: E<strong>la</strong>boración propia a partir <strong>de</strong> <strong>la</strong> Imagen Final <strong>de</strong> <strong>la</strong> Demanda 1995, 2001 y <strong>actual</strong>ización 2002 y 2003.<br />
CUOTA DE REPARTO MODAL SEGÚN TIPOLOGÍA DE VIAJE<br />
% (año 1995) % (año 2001) % (año 2002) % (año 2003)<br />
Carretera Ferrocarril Aéreo Marítimo Total Carretera Ferrocarril Aéreo Marítimo Total Carretera Ferrocarril Aéreo Marítimo Total Carretera Ferrocarril Aéreo Marítimo Total<br />
Viajes Internos 97,1 2,4 0,0 0,5 100,0 99,1 0,9 0,0 0,0 100,0 98,9 1,1 0,0 0,0 100,0 99,1 0,9 0,0 0,0 100,0<br />
Viajes Originados 60,5 4,4 0,0 35,1 100,0 68,4 3,5 0,1 27,9 100,0 70,3 3,6 0,0 26,1 100,0 69,7 3,3 0,0 26,9 100,0<br />
Viajes <strong>de</strong> Tránsito 96,6 3,4 0,0 0,0 100,0 96,5 3,5 0,0 0,0 100,0 94,9 5,1 0,0 0,0 100,0 94,8 5,2 0,0 0,0 100,0<br />
Total 75,2 3,7 0,0 21,1 100,0 80,1 2,8 0,1 17,0 100,0 81,3 3,2 0,0 15,5 100,0 80,8 3,0 0,0 16,2 100,0<br />
Fuente: E<strong>la</strong>boración propia a partir <strong>de</strong> <strong>la</strong> Imagen Final <strong>de</strong> <strong>la</strong> Demanda 1995, 2001 y <strong>actual</strong>ización 2002 y 2003.<br />
249<br />
Revisión <strong>de</strong>l Segundo P<strong>la</strong>n General <strong>de</strong> Carreteras <strong>de</strong>l País Vasco