2. análisis de la situación actual de la red viaria - Garraioak
2. análisis de la situación actual de la red viaria - Garraioak
2. análisis de la situación actual de la red viaria - Garraioak

Create successful ePaper yourself
Turn your PDF publications into a flip-book with our unique Google optimized e-Paper software.
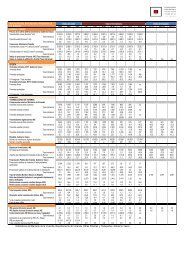
EVOLUCIÓN DE LA ACCIDENTALIDAD (%) SEGÚN TIPO EN LAS CARRETERAS DE LA RED<br />
FUNCIONAL<br />
60,0<br />
55,0<br />
50,0<br />
45,0<br />
40,0<br />
35,0<br />
30,0<br />
25,0<br />
20,0<br />
15,0<br />
10,0<br />
5,0<br />
0,0<br />
PERÍODO 1999 – 2003<br />
1999 2000 2001 2002 2003<br />
Colisión vehículos Colisión <strong>de</strong> vehículo - Obstáculo<br />
Atropello Vuelco en calzada<br />
Salida <strong>de</strong> <strong>la</strong> calzada izquierda Salida <strong>de</strong> <strong>la</strong> calzada <strong>de</strong>recha<br />
Otros<br />
Fuente: E<strong>la</strong>boración propia a partir <strong>de</strong> datos <strong>de</strong> <strong>la</strong> Dirección General <strong>de</strong> Tráfico.<br />
En el año 2003, el porcentaje <strong>de</strong> los acci<strong>de</strong>ntes según su tipo es el que se muestra en el siguiente gráfico.<br />
DISTRIBUCIÓN DE TIPOLOGÍA DE ACCIDENTES EN LAS CARRETERAS DE LA RED FUNCIONAL<br />
14,9%<br />
1,5%<br />
14,9%<br />
2,9%<br />
4,5%<br />
AÑO 2003<br />
5,2%<br />
56,1%<br />
Colisión vehículos Colisión <strong>de</strong> vehículo - Obstáculo<br />
Atropello Vuelco en calzada<br />
Salida <strong>de</strong> <strong>la</strong> calzada izquierda Salida <strong>de</strong> <strong>la</strong> calzada <strong>de</strong>recha<br />
Otros<br />
Fuente: E<strong>la</strong>boración propia a partir <strong>de</strong> datos <strong>de</strong> <strong>la</strong> Dirección General <strong>de</strong> Tráfico.<br />
Territorio Histórico <strong>de</strong> Gipuzkoa<br />
Tipo <strong>de</strong> acci<strong>de</strong>nte<br />
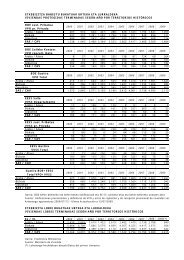
ACCIDENTALIDAD TIPO EN LAS CARRETERAS DE LA RED FUNCIONAL 1<br />
Absoluto<br />
PERÍODO 1999 - 2003<br />
1999 2000 2001 2002 2003<br />
%<br />
s/total<br />
Absoluto %<br />
s/total Absoluto<br />
%<br />
s/total Absoluto<br />
%<br />
s/total<br />
78<br />
Absoluto %<br />
s/total<br />
Colisión <strong>de</strong> vehículos<br />
Frontal 45 9,1 51 10,6 80 6,6 64 5,7 41 4,1<br />
Fronto - <strong>la</strong>teral 115 23,3 106 22,0 163 13,4 158 14,1 124 12,3<br />
Lateral 18 3,6 16 3,3 69 5,7 52 4,6 60 5,9<br />
Alcance 50 10,1 48 10,0 238 19,5 218 19,4 198 19,6<br />
Múltiple o Caravana 8 1,6 9 1,9 41 3,4 33 2,9 33 3,3<br />
Colisión <strong>de</strong> vehículo – obstáculo<br />
Vehículo estacionado /<br />
averiado 3 0,6 0 0,0 4 0,3 4 0,4 2 0,2<br />
Val<strong>la</strong> <strong>de</strong> <strong>de</strong>fensa 6 1,2 5 1,0 26 2,1 32 2,8 44 4,4<br />
Barrera <strong>de</strong> paso a nivel 0 0,0 1 0,2 0 0,0 2 0,2 0 0,0<br />
Otro objeto o material 1 0,2 3 0,6 12 1,0 10 0,9 5 0,5<br />
Atropello<br />
Peatón sosteniendo<br />
bicicleta 0 0,0 1 0,2 0 0,0 0 0,0 1 0,1<br />
Peatón reparando<br />
vehículo 0 0,0 0 0,0 0 0,0 0 0,0 0 0,0<br />
Peatón ais<strong>la</strong>do o en grupo 37 7,5 32 6,6 32 2,6 42 3,7 27 2,7<br />
Conductor <strong>de</strong> animales 0 0,0 0 0,0 0 0,0 0 0,0 0 0,0<br />
Animal conducido o<br />
rebaño 0 0,0 0 0,0 0 0,0 0 0,0 0 0,0<br />
Animales sueltos 1 0,2 0 0,0 0,0 2 0,2 0 0,0<br />
Vuelco en calzada<br />
Vuelco en calzada 14 2,8 12 2,5 38 3,1 31 2,8 40 4,0<br />
Salida <strong>de</strong> <strong>la</strong> calzada izquierda<br />
Choque con árbol o poste 9 1,8 13 2,7 19 1,6 17 1,5 15 1,5<br />
Choque con murete o<br />
edificio 22 4,5 14 2,9 50 4,1 54 4,8 46 4,6<br />
Choque con cuneta o<br />
bordillo 8 1,6 13 2,7 41 3,4 35 3,1 37 3,7<br />
Otro tipo <strong>de</strong> choque 12 2,4 18 3,7 46 3,8 49 4,4 45 4,5<br />
Con <strong>de</strong>speñamiento 1 0,2 3 0,6 5 0,4 0 0,0 1 0,1<br />
Con vuelco 8 1,6 8 1,7 19 1,6 13 1,2 11 1,1<br />
Revisión <strong>de</strong>l Segundo P<strong>la</strong>n General <strong>de</strong> Carreteras <strong>de</strong>l País Vasco