2. análisis de la situación actual de la red viaria - Garraioak
2. análisis de la situación actual de la red viaria - Garraioak
2. análisis de la situación actual de la red viaria - Garraioak

You also want an ePaper? Increase the reach of your titles
YUMPU automatically turns print PDFs into web optimized ePapers that Google loves.
Territorio Histórico <strong>de</strong> Bizkaia<br />
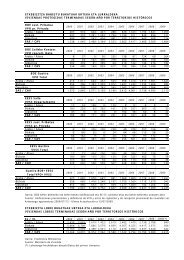
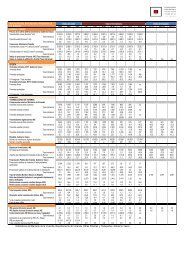
ACCIDENTALIDAD SEGÚN TIPO EN LAS CARRETERAS DE LA RED FUNCIONAL 1<br />
Tipo <strong>de</strong> acci<strong>de</strong>nte<br />
Colisión <strong>de</strong> vehículos<br />
PERÍODO 1999 - 2003<br />
1999 2000 2001 2002 2003<br />
Absoluto %<br />
s/total<br />
Absoluto %<br />
s/total<br />
Absoluto %<br />
s/total<br />
Absoluto %<br />
s/total<br />
Absoluto %<br />
s/total<br />
Frontal 83 8,0 90 6,6 91 6,1 86 5,9 82 5,2<br />
Fronto - <strong>la</strong>teral 200 19,4 211 15,6 218 14,7 246 16,9 238 15,2<br />
Lateral 53 5,1 83 6,1 88 5,9 83 5,7 94 6,0<br />
Alcance 218 21,1 327 24,1 332 22,4 364 25,0 407 26,0<br />
Múltiple o Caravana 54 5,2 58 4,3 68 4,6 36 2,5 58 3,7<br />
Colisión <strong>de</strong> vehículo – obstáculo<br />
Vehículo estacionado o<br />
averiado 3 0,3 4 0,3 8 0,5 3 0,2 4 0,3<br />
Val<strong>la</strong> <strong>de</strong> <strong>de</strong>fensa 40 3,9 72 5,3 122 8,2 51 3,5 64 4,1<br />
Barrera <strong>de</strong> paso a nivel 0 0,0 0 0,0 0 0,0 0 0,0 1 0,1<br />
Otro objeto o material 6 0,6 7 0,5 7 0,5 10 0,7 2 0,1<br />
Atropello<br />
Peatón sosteniendo<br />
bicicleta 2 0,2 0 0,0 0 0,0 0 0,0 1 0,1<br />
Peatón reparando<br />
vehículo 0 0,0 0 0,0 0 0,0 0 0,0 0 0,0<br />
Peatón ais<strong>la</strong>do o en grupo 41 4,0 28 2,1 31 2,1 40 2,7 40 2,6<br />
Conductor <strong>de</strong> animales 0 0,0 0 0,0 0 0,0 0 0,0 0 0,0<br />
Animal conducido o<br />
rebaño 0 0,0 0 0,0 0 0,0 0 0,0 0 0,0<br />
Animales sueltos 0 0,0 1 0,1 5 0,3 1 0,1 4 0,3<br />
Vuelco en calzada<br />
Vuelco en calzada 19 1,8 33 2,4 23 1,5 23 1,6 24 1,5<br />
Salida <strong>de</strong> <strong>la</strong> calzada izquierda<br />
Choque con árbol o poste 16 1,6 15 1,1 18 1,2 27 1,9 24 1,5<br />
Choque con murete o<br />
edificio 28 2,7 34 2,5 35 2,4 54 3,7 76 4,8<br />
Choque con cuneta o<br />
bordillo 37 3,6 33 2,4 48 3,2 35 2,4 38 2,4<br />
Otro tipo <strong>de</strong> choque 22 2,1 36 2,7 37 2,5 41 2,8 55 3,5<br />
Con <strong>de</strong>speñamiento 4 0,4 5 0,4 7 0,5 8 0,5 5 0,3<br />
Con vuelco 8 0,8 14 1,0 14 0,9 28 1,9 31 2,0<br />
Tipo <strong>de</strong> acci<strong>de</strong>nte<br />
1999 2000 2001 2002 2003<br />
Absoluto %<br />
s/total<br />
Absoluto %<br />
s/total<br />
Absoluto %<br />
s/total<br />
Absoluto %<br />
s/total<br />
77<br />
Absoluto %<br />
s/total<br />
En l<strong>la</strong>no 1 0,1 3 0,2 0 0,0 1 0,1 2 0,1<br />
Otra 3 0,3 51 3,8 2 0,1 1 0,1 3 0,2<br />
Salida <strong>de</strong> <strong>la</strong> calzada <strong>de</strong>recha<br />
Choque con árbol o poste 28 2,7 31 2,3 44 3,0 32 2,2 24 1,5<br />
Choque con murete o<br />
edificio 38 3,7 56 4,1 75 5,1 75 5,2 76 4,8<br />
Choque con cuneta o<br />
bordillo 32 3,1 34 2,5 56 3,8 45 3,1 38 2,4<br />
Otro tipo <strong>de</strong> choque 23 2,2 41 3,0 48 3,2 61 4,2 55 3,5<br />
Con <strong>de</strong>speñamiento 7 0,7 10 0,7 9 0,6 9 0,6 5 0,3<br />
Con vuelco 26 2,5 26 1,9 27 1,8 33 2,3 31 2,0<br />
En l<strong>la</strong>no 1 0,1 2 0,1 8 0,5 1 0,1 2 0,1<br />
Otra 3 0,3 5 0,4 1 0,1 4 0,3 3 0,2<br />
Otros<br />
Otro 36 3,5 46 3,4 63 4,2 57 3,9 81 5,2<br />
Fuente: E<strong>la</strong>boración propia a partir <strong>de</strong> datos <strong>de</strong> <strong>la</strong> Dirección General <strong>de</strong> Tráfico.<br />
Tal y como ha ocurrido en los dos Territorios Históricos anteriores, es <strong>la</strong> colisión <strong>de</strong> vehículos <strong>la</strong> principal<br />
causa <strong>de</strong> acci<strong>de</strong>ntalidad en Bizkaia y en <strong>la</strong>s carreteras <strong>de</strong> <strong>la</strong> Red Funcional. En este caso, el porcentaje <strong>de</strong><br />
este tipo <strong>de</strong> acci<strong>de</strong>ntes cada uno <strong>de</strong> los años consi<strong>de</strong>rados (<strong>de</strong>s<strong>de</strong> 1999 hasta 2003) es mayor que en Á<strong>la</strong>va<br />
y en Gipuzkoa, ya que <strong>la</strong> media <strong>de</strong> los cinco años supera el 55%. También, e igual que anteriormente, es <strong>la</strong><br />
colisión fronto - <strong>la</strong>teral y el alcance <strong>la</strong>s dos razones que dan lugar al mayor número <strong>de</strong> acci<strong>de</strong>ntes por<br />
colisión <strong>de</strong> vehículos.<br />
Se siguen manteniendo en segunda y tercera posición (en cuanto a <strong>la</strong> causa <strong>de</strong> acci<strong>de</strong>ntalidad en <strong>la</strong>s<br />
carreteras <strong>de</strong> <strong>la</strong> Red Funcional), <strong>la</strong>s salidas <strong>de</strong> calzada por ambos márgenes (<strong>de</strong>recho e izquierdo).<br />
Observando como aunque su evolución ha sido diferente a lo <strong>la</strong>rgo <strong>de</strong> estos cinco años, el porcentaje <strong>de</strong><br />
acci<strong>de</strong>ntes <strong>de</strong> ambas coinci<strong>de</strong> en el último año (14,9%).<br />
El vuelco <strong>de</strong> calzada se mantiene <strong>de</strong>s<strong>de</strong> el año 1999 hasta el año 2003 como <strong>la</strong> razón que menos acci<strong>de</strong>ntes<br />
provoca.<br />
Revisión <strong>de</strong>l Segundo P<strong>la</strong>n General <strong>de</strong> Carreteras <strong>de</strong>l País Vasco