2. análisis de la situación actual de la red viaria - Garraioak
2. análisis de la situación actual de la red viaria - Garraioak
2. análisis de la situación actual de la red viaria - Garraioak

Create successful ePaper yourself
Turn your PDF publications into a flip-book with our unique Google optimized e-Paper software.
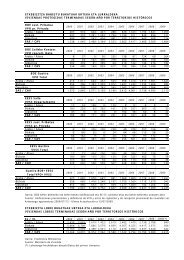
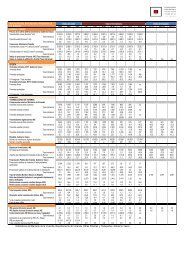
LESIVIDAD EN LAS CARRETERAS DE LA RED FUNCIONAL. PERÍODO 1999 – 2003<br />
Territorio Histórico<br />
y año<br />
Á<strong>la</strong>va<br />
Bizkaia<br />
Gipuzkoa<br />
CAPV<br />
Personas muertas Heridos graves Heridos leves Total víctimas<br />
Nº % Nº % Nº % Nº % s/CAPV<br />
1999 47 8,1 201 34,7 331 57,2 579 18,0<br />
2000 36 5,9 204 33,6 368 60,5 608 16,5<br />
2001 50 6,7 191 25,7 501 67,5 742 15,1<br />
2002 37 4,5 165 20,0 624 75,5 826 15,5<br />
2003 36 4,3 135 16,1 668 79,6 839 15,8<br />
1999 49 2,8 291 16,4 1.433 80,8 1.773 55,2<br />
2000 48 2,2 279 12,8 1.859 85,0 <strong>2.</strong>186 59,5<br />
2001 47 2,0 272 11,9 1.974 86,1 <strong>2.</strong>293 46,5<br />
2002 68 2,4 316 11,2 <strong>2.</strong>436 86,4 <strong>2.</strong>820 52,8<br />
2003 57 2,1 259 9,5 <strong>2.</strong>408 88,4 <strong>2.</strong>724 51,2<br />
1999 50 5,8 221 25,7 588 68,5 859 26,8<br />
2000 48 5,4 253 28,7 581 65,9 882 24,0<br />
2001 43 2,3 272 14,4 1.579 83,4 1.894 38,4<br />
2002 51 3,0 220 13,0 1.419 84,0 1.690 31,7<br />
2003 56 3,2 216 12,3 1.482 84,5 1.754 33,0<br />
1999 146 4,5 713 22,2 <strong>2.</strong>352 73,2 3.211 100,0<br />
2000 132 3,6 736 20,0 2808 76,4 3.676 100,0<br />
2001 140 2,8 735 14,9 4054 82,2 4.929 100,0<br />
2002 156 2,9 701 13,1 4479 83,9 5.336 100,0<br />
2003 149 2,8 610 11,5 4558 85,7 5.317 100,0<br />
Fuente: E<strong>la</strong>boración propia a partir <strong>de</strong> datos <strong>de</strong> <strong>la</strong> Dirección General <strong>de</strong> Tráfico.<br />
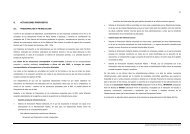
DISTRIBUCIÓN DE VÍCTIMAS EN LAS CARRETERAS DE LA RED FUNCIONAL<br />
51,2%<br />
AÑO 2003<br />
Á<strong>la</strong>va Gipuzkoa Bizkaia<br />
15,8%<br />
33,0%<br />
Fuente: E<strong>la</strong>boración propia a partir <strong>de</strong> datos <strong>de</strong> <strong>la</strong> Dirección General <strong>de</strong> Tráfico.<br />
El número <strong>de</strong> víctimas en <strong>la</strong>s carreteras <strong>de</strong> <strong>la</strong> Red Funcional ha crecido <strong>de</strong>s<strong>de</strong> el año 1999 hasta el año 2003<br />
en toda <strong>la</strong> Comunidad Autónoma <strong>de</strong>l País Vasco. Este crecimiento ha sido más acusado en Gipuzkoa, don<strong>de</strong><br />
<strong>la</strong> tasa <strong>de</strong> crecimiento anual acumu<strong>la</strong>do para el período <strong>de</strong> <strong>análisis</strong> ascien<strong>de</strong> al 19,5%, le sigue con una tasa<br />
<strong>de</strong>l 11,3% el Territorio Histórico <strong>de</strong> Bizkaia y finalmente con un 9,7% Á<strong>la</strong>va.<br />
Cabe seña<strong>la</strong>r, sin embargo, que en Bizkaia <strong>la</strong> ten<strong>de</strong>ncia creciente se invierte en 2003, cuando el número <strong>de</strong><br />
víctimas mortales <strong>de</strong>scien<strong>de</strong> un 16% con respecto al año anterior. En Gipuzkoa, por su parte, se observa<br />
también un cambio <strong>de</strong> ten<strong>de</strong>ncia a <strong>la</strong> baja a partir <strong>de</strong> 2004, año en que el número <strong>de</strong> acci<strong>de</strong>ntes mortales<br />
fue <strong>de</strong> 34, lo que representa un <strong>de</strong>scenso <strong>de</strong>l 39% con respecto a 2003.<br />
Por otra parte, <strong>de</strong> igual manera que el número <strong>de</strong> acci<strong>de</strong>ntes con víctimas era mayor en Bizkaia, el número<br />
<strong>de</strong> personas implicadas en los mismos es también mayor en este Territorio Histórico, resultando en el año<br />
2003 <strong>2.</strong>724 víctimas (lo que supone el 51,2% <strong>de</strong>l total <strong>de</strong> víctimas que tienen lugar en <strong>la</strong>s carreteras <strong>de</strong> <strong>la</strong><br />
Red Funcional <strong>de</strong> <strong>la</strong> CAPV). Á<strong>la</strong>va es don<strong>de</strong> este número es el menor <strong>de</strong> todos, con tan sólo 839 víctimas<br />
(15,8% respecto al total <strong>de</strong>l País Vasco).<br />
73<br />
Revisión <strong>de</strong>l Segundo P<strong>la</strong>n General <strong>de</strong> Carreteras <strong>de</strong>l País Vasco