El talento humano factor clave para la sustentabilidad e innovación de las organizaciones

You also want an ePaper? Increase the reach of your titles
YUMPU automatically turns print PDFs into web optimized ePapers that Google loves.
Países<br />
Prueba <strong>de</strong> causalidad Granger entre<br />
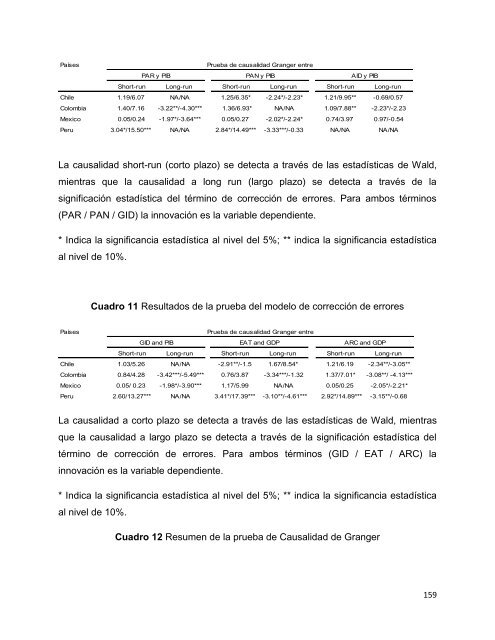
PAR y PIB PAN y PIB AID y PIB<br />
Short-run Long-run Short-run Long-run Short-run Long-run<br />
Chile 1.19/6.07 NA/NA 1.25/6.35* -2.24*/-2.23* 1.21/9.95** -0.69/0.57<br />
Colombia 1.40/7.16 -3.22**/-4.30*** 1.36/6.93* NA/NA 1.09/7.88** -2.23*/-2.23<br />
Mexico 0.05/0.24 -1.97*/-3.64*** 0.05/0.27 -2.02*/-2.24* 0.74/3.97 0.97/-0.54<br />
Peru 3.04*/15.50*** NA/NA 2.84*/14.49*** -3.33***/-0.33 NA/NA NA/NA<br />
La causalidad short-run (corto p<strong>la</strong>zo) se <strong>de</strong>tecta a través <strong>de</strong> <strong>la</strong>s estadísticas <strong>de</strong> Wald,<br />
mientras que <strong>la</strong> causalidad a long run (<strong>la</strong>rgo p<strong>la</strong>zo) se <strong>de</strong>tecta a través <strong>de</strong> <strong>la</strong><br />
significación estadística <strong>de</strong>l término <strong>de</strong> corrección <strong>de</strong> errores. Para ambos términos<br />
(PAR / PAN / GID) <strong>la</strong> <strong>innovación</strong> es <strong>la</strong> variable <strong>de</strong>pendiente.<br />
* Indica <strong>la</strong> significancia estadística al nivel <strong>de</strong>l 5%; ** indica <strong>la</strong> significancia estadística<br />
al nivel <strong>de</strong> 10%.<br />
Cuadro 11 Resultados <strong>de</strong> <strong>la</strong> prueba <strong>de</strong>l mo<strong>de</strong>lo <strong>de</strong> corrección <strong>de</strong> errores<br />
Países<br />
Prueba <strong>de</strong> causalidad Granger entre<br />
GID and PIB EAT and GDP ARC and GDP<br />
Short-run Long-run Short-run Long-run Short-run Long-run<br />
Chile 1.03/5.26 NA/NA -2.91**/-1.5 1.67/8.54* 1.21/6.19 -2.34**/-3.05**<br />
Colombia 0.84/4.28 -3.42***/-5.49*** 0.76/3.87 -3.34***/-1.32 1.37/7.01* -3.08**/ -4.13***<br />
Mexico 0.05/ 0.23 -1.98*/-3.90*** 1.17/5.99 NA/NA 0.05/0.25 -2.05*/-2.21*<br />
Peru 2.60/13.27*** NA/NA 3.41*/17.39*** -3.10**/-4.61*** 2.92*/14.89*** -3.15**/-0.68<br />
La causalidad a corto p<strong>la</strong>zo se <strong>de</strong>tecta a través <strong>de</strong> <strong>la</strong>s estadísticas <strong>de</strong> Wald, mientras<br />
que <strong>la</strong> causalidad a <strong>la</strong>rgo p<strong>la</strong>zo se <strong>de</strong>tecta a través <strong>de</strong> <strong>la</strong> significación estadística <strong>de</strong>l<br />
término <strong>de</strong> corrección <strong>de</strong> errores. Para ambos términos (GID / EAT / ARC) <strong>la</strong><br />
<strong>innovación</strong> es <strong>la</strong> variable <strong>de</strong>pendiente.<br />
* Indica <strong>la</strong> significancia estadística al nivel <strong>de</strong>l 5%; ** indica <strong>la</strong> significancia estadística<br />
al nivel <strong>de</strong> 10%.<br />
Cuadro 12 Resumen <strong>de</strong> <strong>la</strong> prueba <strong>de</strong> Causalidad <strong>de</strong> Granger<br />
159