- Page 2 and 3:
Intégrer les services pour le main
- Page 4 and 5:
Tous droits réservés © 2004 Edis
- Page 6 and 7:
Auteurs et collaborateurs Allard Gu
- Page 8 and 9:
AUTEURS ET COLLABORATEURS ix Durand
- Page 10 and 11:
AUTEURS ET COLLABORATEURS xi Somme
- Page 12 and 13:
xiv PRISMA 11. Relation entre le co
- Page 14 and 15:
2 INTÉGRER LES SERVICES POUR LE MA
- Page 16 and 17:
4 INTÉGRER LES SERVICES POUR LE MA
- Page 18 and 19:
6 INTÉGRER LES SERVICES POUR LE MA
- Page 21 and 22:
1. PRISMA : Un modèle novateur pou
- Page 23 and 24:
UN MODÈLE NOVATEUR POUR L’INTÉG
- Page 25 and 26:
UN MODÈLE NOVATEUR POUR L’INTÉG
- Page 27 and 28:
UN MODÈLE NOVATEUR POUR L’INTÉG
- Page 29 and 30:
UN MODÈLE NOVATEUR POUR L’INTÉG
- Page 31 and 32:
UN MODÈLE NOVATEUR POUR L’INTÉG
- Page 33 and 34:
UN MODÈLE NOVATEUR POUR L’INTÉG
- Page 35:
UN MODÈLE NOVATEUR POUR L’INTÉG
- Page 38 and 39:
26 INTÉGRER LES SERVICES POUR LE M
- Page 40 and 41:
28 INTÉGRER LES SERVICES POUR LE M
- Page 42 and 43:
30 INTÉGRER LES SERVICES POUR LE M
- Page 44 and 45:
32 INTÉGRER LES SERVICES POUR LE M
- Page 46 and 47:
34 INTÉGRER LES SERVICES POUR LE M
- Page 48 and 49:
36 INTÉGRER LES SERVICES POUR LE M
- Page 50 and 51:
38 INTÉGRER LES SERVICES POUR LE M
- Page 53 and 54:
3. Évaluation de l’implantation
- Page 55 and 56:
ÉVALUATION DE L’IMPLANTATION DU
- Page 57 and 58:
ÉVALUATION DE L’IMPLANTATION DU
- Page 59 and 60:
ÉVALUATION DE L’IMPLANTATION DU
- Page 61 and 62:
ÉVALUATION DE L’IMPLANTATION DU
- Page 63 and 64:
ÉVALUATION DE L’IMPLANTATION DU
- Page 65 and 66:
ÉVALUATION DE L’IMPLANTATION DU
- Page 67:
ÉVALUATION DE L’IMPLANTATION DU
- Page 70 and 71:
58 INTÉGRER LES SERVICES POUR LE M
- Page 72 and 73:
60 INTÉGRER LES SERVICES POUR LE M
- Page 74 and 75:
62 INTÉGRER LES SERVICES POUR LE M
- Page 76 and 77:
64 INTÉGRER LES SERVICES POUR LE M
- Page 78 and 79:
66 INTÉGRER LES SERVICES POUR LE M
- Page 80 and 81:
68 INTÉGRER LES SERVICES POUR LE M
- Page 82 and 83:
70 INTÉGRER LES SERVICES POUR LE M
- Page 84 and 85:
72 INTÉGRER LES SERVICES POUR LE M
- Page 86 and 87:
74 INTÉGRER LES SERVICES POUR LE M
- Page 88 and 89:
76 INTÉGRER LES SERVICES POUR LE M
- Page 90 and 91:
78 INTÉGRER LES SERVICES POUR LE M
- Page 92 and 93:
80 INTÉGRER LES SERVICES POUR LE M
- Page 94 and 95:
82 INTÉGRER LES SERVICES POUR LE M
- Page 96 and 97:
84 INTÉGRER LES SERVICES POUR LE M
- Page 98 and 99:
86 INTÉGRER LES SERVICES POUR LE M
- Page 100 and 101:
88 INTÉGRER LES SERVICES POUR LE M
- Page 102 and 103:
90 INTÉGRER LES SERVICES POUR LE M
- Page 104 and 105:
92 INTÉGRER LES SERVICES POUR LE M
- Page 106 and 107:
94 INTÉGRER LES SERVICES POUR LE M
- Page 108 and 109:
96 INTÉGRER LES SERVICES POUR LE M
- Page 110 and 111:
98 INTÉGRER LES SERVICES POUR LE M
- Page 112 and 113:
100 INTÉGRER LES SERVICES POUR LE
- Page 114 and 115:
102 INTÉGRER LES SERVICES POUR LE
- Page 116 and 117:
104 INTÉGRER LES SERVICES POUR LE
- Page 118 and 119:
106 INTÉGRER LES SERVICES POUR LE
- Page 120 and 121:
108 INTÉGRER LES SERVICES POUR LE
- Page 122 and 123:
110 INTÉGRER LES SERVICES POUR LE
- Page 124 and 125:
112 INTÉGRER LES SERVICES POUR LE
- Page 126 and 127:
114 INTÉGRER LES SERVICES POUR LE
- Page 128 and 129:
116 INTÉGRER LES SERVICES POUR LE
- Page 130 and 131:
118 INTÉGRER LES SERVICES POUR LE
- Page 132 and 133:
120 INTÉGRER LES SERVICES POUR LE
- Page 134 and 135:
122 INTÉGRER LES SERVICES POUR LE
- Page 136 and 137:
124 INTÉGRER LES SERVICES POUR LE
- Page 138 and 139:
126 INTÉGRER LES SERVICES POUR LE
- Page 140 and 141:
128 INTÉGRER LES SERVICES POUR LE
- Page 142 and 143:
130 INTÉGRER LES SERVICES POUR LE
- Page 144 and 145:
132 INTÉGRER LES SERVICES POUR LE
- Page 146 and 147:
134 INTÉGRER LES SERVICES POUR LE
- Page 148 and 149:
136 INTÉGRER LES SERVICES POUR LE
- Page 150 and 151:
138 INTÉGRER LES SERVICES POUR LE
- Page 152 and 153:
140 INTÉGRER LES SERVICES POUR LE
- Page 154 and 155:
142 INTÉGRER LES SERVICES POUR LE
- Page 156 and 157:
144 INTÉGRER LES SERVICES POUR LE
- Page 158 and 159:
146 INTÉGRER LES SERVICES POUR LE
- Page 160 and 161:
148 INTÉGRER LES SERVICES POUR LE
- Page 162 and 163:
150 INTÉGRER LES SERVICES POUR LE
- Page 165 and 166:
8. Guide d’utilisation du questio
- Page 167 and 168:
GUIDE D’UTILISATION DU QUESTIONNA
- Page 169 and 170:
GUIDE D’UTILISATION DU QUESTIONNA
- Page 171 and 172:
{ { GUIDE D’UTILISATION DU QUESTI
- Page 173 and 174: GUIDE D’UTILISATION DU QUESTIONNA
- Page 175 and 176: GUIDE D’UTILISATION DU QUESTIONNA
- Page 177 and 178: GUIDE D’UTILISATION DU QUESTIONNA
- Page 179 and 180: GUIDE D’UTILISATION DU QUESTIONNA
- Page 181 and 182: GUIDE D’UTILISATION DU QUESTIONNA
- Page 183 and 184: GUIDE D’UTILISATION DU QUESTIONNA
- Page 185 and 186: GUIDE D’UTILISATION DU QUESTIONNA
- Page 187: GUIDE D’UTILISATION DU QUESTIONNA
- Page 190 and 191: 178 INTÉGRER LES SERVICES POUR LE
- Page 192 and 193: 180 INTÉGRER LES SERVICES POUR LE
- Page 194 and 195: 182 INTÉGRER LES SERVICES POUR LE
- Page 196 and 197: 184 INTÉGRER LES SERVICES POUR LE
- Page 198 and 199: 186 INTÉGRER LES SERVICES POUR LE
- Page 200 and 201: 188 INTÉGRER LES SERVICES POUR LE
- Page 202 and 203: 190 INTÉGRER LES SERVICES POUR LE
- Page 204 and 205: 192 INTÉGRER LES SERVICES POUR LE
- Page 206 and 207: 194 INTÉGRER LES SERVICES POUR LE
- Page 208 and 209: 196 INTÉGRER LES SERVICES POUR LE
- Page 210 and 211: 198 INTÉGRER LES SERVICES POUR LE
- Page 212 and 213: 200 INTÉGRER LES SERVICES POUR LE
- Page 214 and 215: 202 INTÉGRER LES SERVICES POUR LE
- Page 216 and 217: 204 INTÉGRER LES SERVICES POUR LE
- Page 218 and 219: 206 INTÉGRER LES SERVICES POUR LE
- Page 220 and 221: 208 INTÉGRER LES SERVICES POUR LE
- Page 222 and 223: 210 INTÉGRER LES SERVICES POUR LE
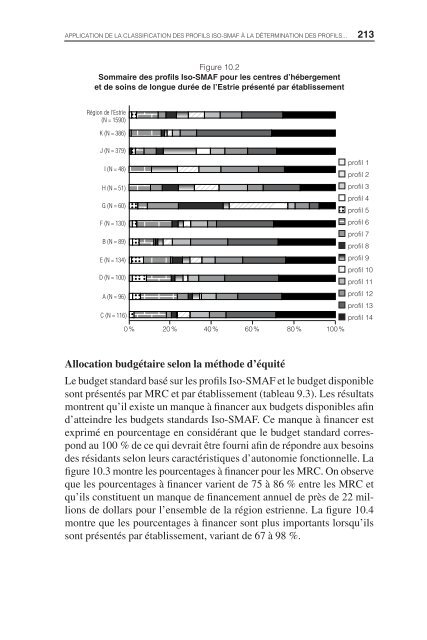
- Page 226 and 227: 214 INTÉGRER LES SERVICES POUR LE
- Page 228 and 229: 216 INTÉGRER LES SERVICES POUR LE
- Page 230 and 231: 218 INTÉGRER LES SERVICES POUR LE
- Page 233 and 234: 11. Relation entre le coût des mé
- Page 235 and 236: RELATION ENTRE LE COÛT DES MÉDICA
- Page 237 and 238: RELATION ENTRE LE COÛT DES MÉDICA
- Page 239 and 240: RELATION ENTRE LE COÛT DES MÉDICA
- Page 241 and 242: RELATION ENTRE LE COÛT DES MÉDICA
- Page 243 and 244: RELATION ENTRE LE COÛT DES MÉDICA
- Page 245 and 246: RELATION ENTRE LE COÛT DES MÉDICA
- Page 247 and 248: 12. Programme de soutien à domicil
- Page 249 and 250: PROGRAMME DE SOUTIEN À DOMICILE :
- Page 251 and 252: PROGRAMME DE SOUTIEN À DOMICILE :
- Page 253 and 254: PROGRAMME DE SOUTIEN À DOMICILE :
- Page 255 and 256: PROGRAMME DE SOUTIEN À DOMICILE :
- Page 257 and 258: PROGRAMME DE SOUTIEN À DOMICILE :
- Page 259 and 260: PROGRAMME DE SOUTIEN À DOMICILE :
- Page 261 and 262: PROGRAMME DE SOUTIEN À DOMICILE :
- Page 263 and 264: 13. Aspects financiers liés à l
- Page 265 and 266: ASPECTS FINANCIERS LIÉS À L’INT
- Page 267 and 268: ASPECTS FINANCIERS LIÉS À L’INT
- Page 269 and 270: ASPECTS FINANCIERS LIÉS À L’INT
- Page 271 and 272: ASPECTS FINANCIERS LIÉS À L’INT
- Page 273 and 274: ASPECTS FINANCIERS LIÉS À L’INT
- Page 275 and 276:
ASPECTS FINANCIERS LIÉS À L’INT
- Page 277 and 278:
ASPECTS FINANCIERS LIÉS À L’INT
- Page 279 and 280:
14. Les variables associées à la
- Page 281 and 282:
LES VARIABLES ASSOCIÉES À LA SATI
- Page 283 and 284:
LES VARIABLES ASSOCIÉES À LA SATI
- Page 285 and 286:
LES VARIABLES ASSOCIÉES À LA SATI
- Page 287 and 288:
LES VARIABLES ASSOCIÉES À LA SATI
- Page 289 and 290:
LES VARIABLES ASSOCIÉES À LA SATI
- Page 291 and 292:
LES VARIABLES ASSOCIÉES À LA SATI
- Page 293 and 294:
15. Le plan de services individuali
- Page 295 and 296:
LE PLAN DE SERVICES INDIVIDUALISÉ
- Page 297 and 298:
LE PLAN DE SERVICES INDIVIDUALISÉ
- Page 299 and 300:
LE PLAN DE SERVICES INDIVIDUALISÉ
- Page 301 and 302:
LE PLAN DE SERVICES INDIVIDUALISÉ
- Page 303 and 304:
LE PLAN DE SERVICES INDIVIDUALISÉ
- Page 305 and 306:
LE PLAN DE SERVICES INDIVIDUALISÉ
- Page 307 and 308:
LE PLAN DE SERVICES INDIVIDUALISÉ
- Page 309 and 310:
LE PLAN DE SERVICES INDIVIDUALISÉ
- Page 311:
LE PLAN DE SERVICES INDIVIDUALISÉ
- Page 314 and 315:
302 INTÉGRER LES SERVICES POUR LE
- Page 316 and 317:
304 INTÉGRER LES SERVICES POUR LE
- Page 318 and 319:
306 INTÉGRER LES SERVICES POUR LE
- Page 320 and 321:
308 INTÉGRER LES SERVICES POUR LE
- Page 322 and 323:
310 INTÉGRER LES SERVICES POUR LE
- Page 324 and 325:
312 INTÉGRER LES SERVICES POUR LE
- Page 326 and 327:
314 INTÉGRER LES SERVICES POUR LE
- Page 328 and 329:
316 INTÉGRER LES SERVICES POUR LE
- Page 330 and 331:
318 INTÉGRER LES SERVICES POUR LE
- Page 332 and 333:
320 INTÉGRER LES SERVICES POUR LE
- Page 334 and 335:
322 INTÉGRER LES SERVICES POUR LE
- Page 336 and 337:
324 INTÉGRER LES SERVICES POUR LE
- Page 338 and 339:
326 INTÉGRER LES SERVICES POUR LE
- Page 340 and 341:
328 INTÉGRER LES SERVICES POUR LE
- Page 342 and 343:
330 INTÉGRER LES SERVICES POUR LE
- Page 344 and 345:
332 INTÉGRER LES SERVICES POUR LE
- Page 346 and 347:
334 INTÉGRER LES SERVICES POUR LE


