Expoente de Lyapunov para um Gás de Lennard–Jones - CBPFIndex
Expoente de Lyapunov para um Gás de Lennard–Jones - CBPFIndex
Expoente de Lyapunov para um Gás de Lennard–Jones - CBPFIndex

Create successful ePaper yourself
Turn your PDF publications into a flip-book with our unique Google optimized e-Paper software.
5. Dinâmica Molecular: Teoria 61<br />
2<br />
1<br />
0<br />
−1<br />
−2<br />
2<br />
1<br />
0<br />
−1<br />
−2<br />
2<br />
1<br />
0<br />
−1<br />
−2<br />
5.0x10 5<br />
5.0x10 5<br />
5.0x10 5<br />
Fase das Medições<br />
6.0x10 5<br />
Fase das Medições<br />
6.0x10 5<br />
Fase das Medições<br />
6.0x10 5<br />
U<br />
7.0x10 5<br />
K<br />
K + U<br />
U<br />
7.0x10 5<br />
K<br />
K + U<br />
U<br />
7.0x10 5<br />
8.0x10 5<br />
t (passos)<br />
8.0x10 5<br />
t (passos)<br />
8.0x10 5<br />
t (passos)<br />
9.0x10 5<br />
9.0x10 5<br />
9.0x10 5<br />
1.0x10 6<br />
1.0x10 6<br />
1.0x10 6<br />
ρ 0 = 0.01<br />
1.1x10 6<br />
ρ 0 = 0.05<br />
1.1x10 6<br />
ρ 0 = 0.50<br />
1.1x10 6<br />
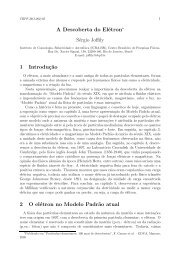
Figura 5.9: Continuação temporal dos gráficos mostrados na figura 5.4. Ao entrar na fase<br />
das medições, o ajuste da temperatura é interrompido e o sistema passa a evoluir<br />
livremente. A energia total (por partícula) E = K + U permanece praticamente<br />
constante (a menos <strong>de</strong> erros n<strong>um</strong>éricos) durante este período. Os gráficos mostrados<br />
na figura 5.10 apresentam <strong>um</strong>a ampliação da energia total.