Attention! Your ePaper is waiting for publication!
By publishing your document, the content will be optimally indexed by Google via AI and sorted into the right category for over 500 million ePaper readers on YUMPU.
This will ensure high visibility and many readers!

Your ePaper is now published and live on YUMPU!
You can find your publication here:
Share your interactive ePaper on all platforms and on your website with our embed function

Management of Commercially Generated Radioactive Waste - U.S. ...
Management of Commercially Generated Radioactive Waste - U.S. ...
Management of Commercially Generated Radioactive Waste - U.S. ...
Create successful ePaper yourself
Turn your PDF publications into a flip-book with our unique Google optimized e-Paper software.
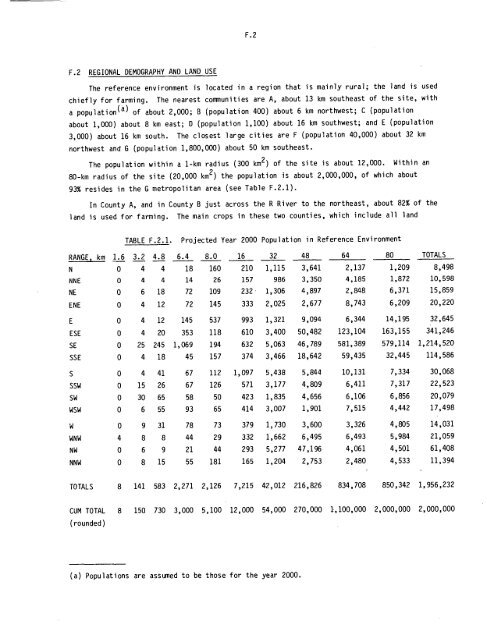
F.2 REGIONAL DEMOGRAPHY AND LAND USE<br />
F.2<br />
The reference environment is located in a region that is mainly rural; the land is used<br />
chiefly for farming. The nearest communities are A, about 13 km southeast <strong>of</strong> the site, with<br />
a population(a) <strong>of</strong> about 2,000; B (population 400) about 6 km northwest; C (population<br />
about 1,000) about 8 km east; D (population 1,100) about 16 km southwest; and E (population<br />
3,000) about 16 km south. The closest large cities are F (population 40,000) about 32 km<br />
northwest and G (population 1,800,000) about 50 km southeast.<br />
The population within a 1-km radius (300 km 2 ) <strong>of</strong> the site is about 12,000. Within an<br />
80-km radius <strong>of</strong> the site (20,000 km 2 ) the population is about 2,000,000, <strong>of</strong> which about<br />
93% resides in the G metropolitan area (see Table F.2.1).<br />
In County A, and in County B just across the R River to the northeast, about 82% <strong>of</strong> the<br />
land is used for farming. The main crops in these two counties, which include all land<br />
TABLE F.2.1. Projected Year 2000 Population in Reference Environment<br />
RANGE, km 1.6 3.2 4.8 6.4 8.0 16 32 48 64 80 TOTALS<br />
N 0 4 4 18 160 210 1,115 3,641 2,137 1,209 8,498<br />
NNE 0 4 4 14 26 157 986 3,350 4,185 1,872 10,598<br />
NE 0 6 18 72 109 232 1,306 4,897 2,848 6,371 15,859<br />
ENE 0 4 12 72 145 333 2,025 2,677 8,743 6,209 20,220<br />
E 0 4 12 145 537 993 1,321 9,094 6,344 14,195 32,645<br />
ESE 0 4 20 353 118 610 3,400 50,482 123,104 163,155 341,246<br />
SE 0 25 245 1,069 194 632 5,063 46,789 581,389 579,114 1,214,520<br />
SSE 0 4 18 45 157 374 3,466 18,642 59,435 32,445 114,586<br />
S 0 4 41 67 112 1,097 5,438 5,844 10,131 7,334 30,068<br />
SSW 0 15 26 67 126 571 3,177 4,809 6,411 7,317 22,523<br />
SW 0 30 65 58 50 423 1,835 4,656 6,106 6,856 20,079<br />
WSW 0 6 55 93 65 414 3,007 1,901 7,515 4,442 17,498<br />
W 0 9 31 78 73 379 1,730 3,600 3,326 4,805 14,031<br />
WNW 4 8 8 44 29 332 1,662 6,495 6,493 5,984 21,059<br />
NW 0 6 9 21 44 293 5,277 47,196 4,061 4,501 61,408<br />
NNW 0 8 15 55 181 165 1,204 2,753 2,480 4,533 11,394<br />
TOTALS 8 141 583 2,271 2,126 7,215 42,012 216,826 834,708 850,342 1,956,232<br />
CUM TOTAL 8 150 730 3,000 5,100 12,000 54,000 270,000 1,100,000 2,000,000 2,000,000<br />
(rounded)<br />
(a) Populations are assumed to be those for the year 2000.
F.1 APPENDIX F REFERENCE ENVIRONMENT FOR ASSESSING ENVIRONMENTAL IMPACTS The following reference environment was developed as an aid in assessing environmental impacts associated with construction and operation <strong>of</strong> waste treatment, interim storage and/or final disposition facilities. The reference environment concept is used to replace, where appropriate, the criteria-type approach to generic environmental assessment. The reference environment was developed primarily from data on existing plant sites in the midwestern United States. There is, however, no intent to endorse this area or type <strong>of</strong> environment for any nuclear fuel cycle facility. Since the reference environment is to be used in a generic or hypothetical sense, references supporting the descriptive material were not considered necessary and are not included. The reference environment is representative <strong>of</strong> the surface geology only and has nothing to do with the deep geology as may be appicable to siting to waste repositories in geologic media. For assessment <strong>of</strong> environmental effects, it is assumed that each waste management facility is located (independently, not collocated) within the reference environment. Although an artificiality, analysis <strong>of</strong> impacts from waste management facilities centered at the same location simplifies calculations and permits direct comparison <strong>of</strong> impacts among facilities on the same environmental features. F.1 LOCATION OF SITE Regardless <strong>of</strong> the size <strong>of</strong> the site or purpose to which it is to be put, the center <strong>of</strong> the site is assumed to be located 8 km west <strong>of</strong> the R River, about 13 km northwest <strong>of</strong> Town A in county A, and 50 km northwest <strong>of</strong> a major metropolitan area (City G) in a midwestern state.
F.2 REGIONAL DEMOGRAPHY AND LAND USE F.2 The reference environment is located in a region that is mainly rural; the land is used chiefly for farming. The nearest communities are A, about 13 km southeast <strong>of</strong> the site, with a population(a) <strong>of</strong> about 2,000; B (population 400) about 6 km northwest; C (population about 1,000) about 8 km east; D (population 1,100) about 16 km southwest; and E (population 3,000) about 16 km south. The closest large cities are F (population 40,000) about 32 km northwest and G (population 1,800,000) about 50 km southeast. The population within a 1-km radius (300 km 2 ) <strong>of</strong> the site is about 12,000. Within an 80-km radius <strong>of</strong> the site (20,000 km 2 ) the population is about 2,000,000, <strong>of</strong> which about 93% resides in the G metropolitan area (see Table F.2.1). In County A, and in County B just across the R River to the northeast, about 82% <strong>of</strong> the land is used for farming. The main crops in these two counties, which include all land TABLE F.2.1. Projected Year 2000 Population in Reference Environment RANGE, km 1.6 3.2 4.8 6.4 8.0 16 32 48 64 80 TOTALS N 0 4 4 18 160 210 1,115 3,641 2,137 1,209 8,498 NNE 0 4 4 14 26 157 986 3,350 4,185 1,872 10,598 NE 0 6 18 72 109 232 1,306 4,897 2,848 6,371 15,859 ENE 0 4 12 72 145 333 2,025 2,677 8,743 6,209 20,220 E 0 4 12 145 537 993 1,321 9,094 6,344 14,195 32,645 ESE 0 4 20 353 118 610 3,400 50,482 123,104 163,155 341,246 SE 0 25 245 1,069 194 632 5,063 46,789 581,389 579,114 1,214,520 SSE 0 4 18 45 157 374 3,466 18,642 59,435 32,445 114,586 S 0 4 41 67 112 1,097 5,438 5,844 10,131 7,334 30,068 SSW 0 15 26 67 126 571 3,177 4,809 6,411 7,317 22,523 SW 0 30 65 58 50 423 1,835 4,656 6,106 6,856 20,079 WSW 0 6 55 93 65 414 3,007 1,901 7,515 4,442 17,498 W 0 9 31 78 73 379 1,730 3,600 3,326 4,805 14,031 WNW 4 8 8 44 29 332 1,662 6,495 6,493 5,984 21,059 NW 0 6 9 21 44 293 5,277 47,196 4,061 4,501 61,408 NNW 0 8 15 55 181 165 1,204 2,753 2,480 4,533 11,394 TOTALS 8 141 583 2,271 2,126 7,215 42,012 216,826 834,708 850,342 1,956,232 CUM TOTAL 8 150 730 3,000 5,100 12,000 54,000 270,000 1,100,000 2,000,000 2,000,000 (rounded) (a) Populations are assumed to be those for the year 2000.
- Page 1 and 2:
FINAL DOE/EIS-0046F Volume 1 of 3 U
- Page 3 and 4:
* Development of conventionally min
- Page 5 and 6:
vi Locations of DOE Regional Office
- Page 7 and 8:
viii CONTENTS (contd) 1.6.3 Acciden
- Page 9 and 10:
CONTENTS (contd) REFERENCES FOR SEC
- Page 11 and 12:
xii CONTENTS (contd) 4.4.3.1 Vault
- Page 13 and 14:
xiv CONTENTS (contd) 4.9.3 Detailed
- Page 15 and 16:
xvi CONTENTS (contd) 5.3.3 Effect o
- Page 17 and 18:
xviii CONTENTS (contd) 6.1.2 Rock M
- Page 19 and 20:
XX CONTENTS (contd) 6.2.1.2 Very De
- Page 21 and 22:
xxii CONTENTS (contd) 6.2.5.5 Islan
- Page 23 and 24:
xxiv FIGURES (contd) 4.3.10 Process
- Page 25 and 26:
xxvi VOLUME 1 TABLES 1.1.1 Total Sp
- Page 27 and 28:
xxviii TABLES (contd) 4.7.7 Dose to
- Page 29 and 30:
XXX TABLES (contd) 5.4.20 Selected
- Page 31 and 32:
xxxii TABLES (contd) 6.1.20 Estimat
- Page 33 and 34:
xxxiv TABLES (contd) 7.4.2 Comparis
- Page 35 and 36:
1.2 The DOE is proposing a program
- Page 37 and 38:
106 ---- - 104 104 : 10 Ce- S - \ -
- Page 39 and 40:
1.2 THE PROGRAMMATIC ALTERNATIVES 1
- Page 41 and 42:
ELEVATOR SHAFT FOR SPENT FUEL OR FU
- Page 43 and 44:
1.10 Once licensing approvals are o
- Page 45 and 46:
1.12 example, a large labor force b
- Page 47 and 48:
1.14 water transport to the biosphe
- Page 49 and 50:
1.16 .1.4 ALTERNATIVE ACTION--BALAN
- Page 51 and 52:
1.18 1.4.5 Ice Sheet Disposal Conce
- Page 53 and 54:
1.20 Space disposal is of interest
- Page 55 and 56:
1.6 PREDISPOSAL SYSTEMS(a) 1.22 Aft
- Page 57 and 58:
1.24 1.7 ENVIRONMENTAL IMPACTS OF P
- Page 59 and 60:
1.26 1.7.1 System Radiological Impa
- Page 61 and 62:
1.28 TABLE 1.7.5. Comparison of Hea
- Page 63 and 64:
1.30 alternative program. The range
- Page 65 and 66:
1.32 * Resource commitments also in
- Page 67 and 68:
REFERENCES FOR CHAPTER 1 1.34 Code
- Page 69 and 70:
PLUTONIUM-URANIUM FUELFABRICATION 2
- Page 71 and 72:
2.4 With regard to receipt and stor
- Page 73 and 74:
Plan, including a summary of the pu
- Page 75 and 76:
2.8 The main body of the text (Volu
- Page 77 and 78:
2.10 2.3 OTHER DECISIONS CONCERNING
- Page 79 and 80:
2.12 The second major decision proc
- Page 81 and 82:
2.14 Using a general conceptual des
- Page 83 and 84:
3.1 CHAPTER 3 DESCRIPTION OF PROGRA
- Page 85 and 86:
3.3 The Interagency Review Group (I
- Page 87 and 88:
3.5 3.1.2 Alternative Action--Paral
- Page 89 and 90:
3.2 BASES FOR THE ANALYSIS 3.7 A nu
- Page 91 and 92:
3.9 ENRICHED NUER WATER BASIN SPENT
- Page 93 and 94:
3.11 wastes also result. These are
- Page 95 and 96:
500 400 300 5 200 -_J 100 - 3.13 CA
- Page 97 and 98:
3.15 3.2.4 Ecological and Atmospher
- Page 99 and 100:
3.17 nue impacts can be provided in
- Page 101 and 102:
3.19 quencies, source terms can be
- Page 103 and 104:
3.21 ownership. The constant dollar
- Page 105 and 106:
3.23 quences to the public followin
- Page 107 and 108:
REFERENCES FOR SECTION 3.2 3.25 Cla
- Page 109 and 110:
3.3.1.1 Cosmic Radiation 3.27 Cosmi
- Page 111 and 112:
3.29 surfaces, and 25 mrem/yr to bo
- Page 113 and 114:
3.31 Part 20 of the Code of Federal
- Page 115 and 116:
3.33 finding and listed radionuclid
- Page 117 and 118:
REFERENCES FOR SECTION 3.3 3.35 Tit
- Page 119 and 120:
3.37 One such hazard index is based
- Page 121 and 122:
3.39 Since long-term repository con
- Page 123 and 124:
3.41 those data that can reasonably
- Page 125 and 126:
3.5 NONTECHNICAL ISSUES 3.43 Many o
- Page 127 and 128:
3.45 the repository. Some feel that
- Page 129 and 130:
3.47 cooperative agreement with the
- Page 131 and 132:
3.49 Inspection, the regular checki
- Page 133 and 134:
REFERENCES FOR SECTION 3.5 3.51 Cod
- Page 135 and 136:
SPENT AT REACTOR AWAY FROM FUEL STO
- Page 137 and 138:
4.4 4.1.2 Predisposal System for th
- Page 139 and 140:
4.6 TABLE 4.1.3. Example Predisposa
- Page 141 and 142:
ONCE-THROUGH CYCLE SPENT FUEL STORA
- Page 143 and 144:
4.10 TABLE 4.2.1. Classification of
- Page 145 and 146:
4.12 BWR fuel models that account f
- Page 147 and 148:
TABLE 4.2.3. Selected Radionuclide
- Page 149 and 150:
4.16 TABLE 4.2.5. Selected Radionuc
- Page 151 and 152:
4.18 ENCAPSULATION SPENT FUEL WATER
- Page 153 and 154:
4.20 Combustible wastes produced du
- Page 155 and 156:
4.22 methods described in Chapter 6
- Page 157 and 158:
4.24 1) vitrification by in-can mel
- Page 159 and 160:
4.26 Some partitioning options may
- Page 161 and 162:
4.28 wells. The 90 Sr leach rate de
- Page 163 and 164:
4.30 Another synthetic mineral conc
- Page 165 and 166:
4.32 Center has been set up to prov
- Page 167 and 168:
4.34 FUEL ASSEMBLY SHEAR RETRIEVE U
- Page 169 and 170:
4.36 may be contact-handled. The qu
- Page 171 and 172:
4.38 4.3.3.4 Immobilization of Wet
- Page 173 and 174:
HEPA FILTER 4.40 CHARCOAL FILTER -
- Page 175 and 176:
4.3.4.2 Gaseous Radionuclide Recove
- Page 177 and 178:
4.44 treatment options at an FRP an
- Page 179 and 180:
4.46 TABLE 4.3.2. Estimated Quantit
- Page 181 and 182:
4.48 Harries, B. R. et al. 1979. De
- Page 183 and 184:
4.50 U.S. Energy Research and Devel
- Page 185 and 186:
4.52 4.4.1.1 Water Basin Storage of
- Page 187 and 188:
4.54. The exhaust air is monitored
- Page 189 and 190:
4.56 but double-walled tanks have b
- Page 191 and 192:
4.58 The storage yard is monitored
- Page 193 and 194:
4.60 A similar approach was examine
- Page 195 and 196:
REFERENCES FOR SECTION 4.4 4.62 Atl
- Page 197 and 198:
4.64 These existing casks were desi
- Page 199 and 200:
4.5.3.1 Fuel Residue Transport 4.66
- Page 201 and 202:
REFERENCES FOR SECTION 4.5 4.68 Per
- Page 203 and 204:
4.70 flanges, and disconnecting ele
- Page 205 and 206:
TABLE 4.6.1. Volumes and Radionucli
- Page 207 and 208:
TABLE 4.6.3. Radionuclides Released
- Page 209 and 210:
4.76 4.7 ENVIRONMENTAL IMPACTS OF P
- Page 211 and 212:
4.78 4.7.1.2 Nonradiological Efflue
- Page 213 and 214:
4.80 The expected socioeconomic imp
- Page 215 and 216:
TABLE 4.7.5. Resource Commitments f
- Page 217 and 218:
4.84 (those to which nearly all wor
- Page 219 and 220:
4.86 TABLE 4.7.8. Example Reprocess
- Page 221 and 222:
4.88 TABLE 4.7.9. Selected Social S
- Page 223 and 224:
4.90 4.8 ACCIDENT IMPACTS FOR PREDI
- Page 225 and 226:
4.92 Severe accidents resulting fro
- Page 227 and 228:
4.94 with a colocated spent fuel pa
- Page 229 and 230:
4.96 such as blowers, pumps, etc. T
- Page 231 and 232:
4.98 occur once per year due to imp
- Page 233 and 234:
REFERENCES FOR SECTION 4.8 Code of
- Page 235 and 236:
TABLE 4.9.1. Unit Costs of Predispo
- Page 237 and 238:
TABLE 4.9.2. Unit Costs of Predispo
- Page 239 and 240:
4.106 TABLE 4.9.3. Predisposal Unit
- Page 241 and 242:
4.108 $109/kg HM, which is comparab
- Page 243 and 244:
4.110 TABLE 4.9.7 Subsystems(a) Was
- Page 245 and 246:
4.112 4.10 SAFEGUARDS INCLUDING PHY
- Page 247 and 248:
4.114 1976). It is assumed that one
- Page 249 and 250:
4.116 The physical protection requi
- Page 251 and 252:
REFERENCES FOR SECTION 4.10 4.118 C
- Page 253 and 254:
5.2 This section provides an overvi
- Page 255 and 256:
5.4 breakdown into component minera
- Page 257 and 258:
5.6 geologic setting may require ex
- Page 259 and 260:
5.8 releases so that substantial nu
- Page 261 and 262:
Hole Sleeve 5.10 The function of ho
- Page 263 and 264:
5.12 integral part of this plan is
- Page 265 and 266:
5.2 STATUS OF TECHNOLOGY AND R&D 5.
- Page 267 and 268:
5.16 Gravity analysis can detect sm
- Page 269 and 270:
5.18 (Witherspoon 1977). Pulse inje
- Page 271 and 272:
5.20 Potentially active faults can
- Page 273 and 274:
5.22 release rate of the nuclides.
- Page 275 and 276:
5.24 5.2.3.1 Excavation and Undergr
- Page 277 and 278:
REFERENCES FOR SECTION 5.2 5.26 Alg
- Page 279 and 280:
5.28 Office of Nuclear Waste Manage
- Page 281 and 282:
5.30 TABLE 5.3.1. Conceptual Reposi
- Page 283 and 284:
BLDG EXCLUSION ZONE AGRICULTURAL FE
- Page 285 and 286:
5.34 areas occupy 650 to 730 ha, wi
- Page 287 and 288:
5.36 emplacement. Beyond this initi
- Page 289 and 290:
5.38 In the case of reprocessing cy
- Page 291 and 292:
5.40 sealed in an appropriately siz
- Page 293 and 294:
5.3.2.5 Retrievability 5.42 These c
- Page 295 and 296:
5.44 erations permit, as opposed to
- Page 297 and 298:
5.46 5.4 ENVIRONMENTAL IMPACTS RELA
- Page 299 and 300:
and no significant impacts are expe
- Page 301 and 302:
5.50 3 TABLE 5.4.6. Particulate Con
- Page 303 and 304:
5.52 5.4.3 Radiological Effects The
- Page 305 and 306:
5.54 chlorosis of young trifoliate
- Page 307 and 308:
5.56 the environment. Discharge of
- Page 309 and 310:
5.58 of wastes, placement of waste
- Page 311 and 312:
5.60 TABLE 5.4.15 Total Quantities
- Page 313 and 314:
5.62 TABLE 5.4.16 Estimated Manpowe
- Page 315 and 316:
5.64 TABLE 5.4.18. Selected Expecte
- Page 317 and 318:
5.66 5.4.6.6 Environmental Effects
- Page 319 and 320:
5.68 The 70-yr worldwide population
- Page 321 and 322:
5.70 The spoils piles could have an
- Page 323 and 324:
5.72 5.5 LONG-TERM ENVIRONMENTAL CO
- Page 325 and 326:
5.74 Fuel Reprocessing Waste Spent
- Page 327 and 328:
5.76 TABLE 5.5.1. First-Year Whole-
- Page 329 and 330:
5.78 The population dose from a met
- Page 331 and 332:
5.80 be from 4 x 10 - 3 to 3 x 10 -
- Page 333 and 334:
5.82 Seventy-year whole-body dose c
- Page 335 and 336:
5.84 Dilution Dilution Element Fact
- Page 337 and 338:
5.86 this conversion, a regional po
- Page 339 and 340:
5.88 probability that the drill (0.
- Page 341 and 342:
5.90 a few years. For purposes of t
- Page 343 and 344:
5.92 dose commitments are less than
- Page 345 and 346:
5.6 COST OF GEOLOGIC DISPOSAL 5.94
- Page 347 and 348:
5.96 kilogram of disposal in a basa
- Page 349 and 350:
5.98 5.6.5 Comparison with Other Co
- Page 351 and 352:
REFERENCES FOR SECTION 5.6 5.100 Be
- Page 353 and 354:
REFERENCES FOR SECTION 5.7 5.102 Co
- Page 355 and 356:
5.104 5.9 SHORT-TERM USES OF THE EN
- Page 357 and 358:
6.1 Chapter 6 ALTERNATIVE CONCEPTS
- Page 359 and 360:
6.3 Concept Summary. The concept su
- Page 361 and 362:
mined geologic repository, are not
- Page 363 and 364:
Reactors Waste Sources LWR Fuel Cyc
- Page 365 and 366:
6.1.1.2 System and Facility Descrip
- Page 367 and 368:
6.11 bridge crane would remove the
- Page 369 and 370:
6.13 For oil field rotary drilling,
- Page 371 and 372:
6.15 diameter of approximately 48 c
- Page 373 and 374:
6.17 * An improved understanding of
- Page 375 and 376:
Health Impacts 6.19 Radiological Ef
- Page 377 and 378:
6.21 The occupational hazards durin
- Page 379 and 380:
Resource Consumption 6.23 The consu
- Page 381 and 382:
6.25 evaluated only on the basis of
- Page 383 and 384:
6.1.1.7 Safeguards 6.27 As noted, t
- Page 385 and 386:
I* LWR Reactors 6.29 Waste Sources
- Page 387 and 388:
Spent and 6.31 Recycle Facilities N
- Page 389 and 390:
6.33 Drilling/Mining System. The re
- Page 391 and 392:
6.35 cause of the limited time, the
- Page 393 and 394:
6.37 are identical with those used
- Page 395 and 396:
6.39 Fracturing During Cooling. Dur
- Page 397 and 398:
6.41 Implementation Time and Estima
- Page 399 and 400:
6.43 TABLE 6.1.8. Occupational Dose
- Page 401 and 402:
6.45 TABLE 6.1.9. Estimated Energy
- Page 403 and 404:
6.47 radioactivity transport, movem
- Page 405 and 406:
6.49 Various options to be consider
- Page 407 and 408:
Reactor 6.51 Recycle Facilities Spe
- Page 409 and 410:
6.53 Repository Facility. The layou
- Page 411 and 412:
6.55 * Development of criteria for
- Page 413 and 414:
6.57 species that recolonize an isl
- Page 415 and 416:
6.59 Radionuclides might be sorbed
- Page 417 and 418:
6.61 Quantitative estimates of thes
- Page 419 and 420:
6.1.4.2 System and Facility Descrip
- Page 421 and 422:
6.65 RH-TRU and other Recycle TRU w
- Page 423 and 424:
6.67 Canisters HLW 2,380 Cladding H
- Page 425 and 426:
6.69 Waste Form. The waste form and
- Page 427 and 428:
6.71 Transportation. Transportation
- Page 429 and 430:
6.73 TABLE 6.1.11. Radiological Imp
- Page 431 and 432:
Socioeconomic Impacts 6.75 Because
- Page 433 and 434:
6.77 wastes (Deese 1976). This trea
- Page 435 and 436:
6.79 In each case, only those costs
- Page 437 and 438:
6.81 total costs are estimated to b
- Page 439 and 440:
Waste Sources Reactors Fuel Cycles
- Page 441 and 442:
Reactor Spent 6.85 M i n ed Recycle
- Page 443 and 444:
6.87 It appears possible, as an alt
- Page 445 and 446:
6.89 deployment of the concept desi
- Page 447 and 448:
6.91 * The capability for correctiv
- Page 449 and 450:
6.93 Other possible land impacts co
- Page 451 and 452:
6.95 6.1.5.5 Potential Impacts over
- Page 453 and 454:
6.97 described for the mined geolog
- Page 455 and 456:
6.99 TABLE 6.1.18. Operating Costs
- Page 457 and 458:
6.101 Isolation from the biosphere
- Page 459 and 460:
6.103 S Fuel R e farication Note: L
- Page 461 and 462:
6.105 would permit different isolat
- Page 463 and 464:
6.107 Shale deposits in the United
- Page 465 and 466:
6.109 Waste Preparation Technology.
- Page 467 and 468:
6.111 to shallow ground water or to
- Page 469 and 470:
6.113 may be conveniently divided i
- Page 471 and 472:
6.115 repositories (Section 5.5) an
- Page 473 and 474:
6.117 The geologic formation in whi
- Page 475 and 476:
6.1.7.1 Concept Summary 6.119 6.1.7
- Page 477 and 478:
The cycle continues by: 6.121 Spent
- Page 479 and 480:
6.123 6.1.7.3 Status of Technical D
- Page 481 and 482:
Implementation Time 6.125 The long
- Page 483 and 484:
6.127 TABLE 6.1.21. Annual Routine
- Page 485 and 486:
6.129 TABLE 6.1.25. Transportation
- Page 487 and 488:
Socioeconomic Impacts 6.131 Socioec
- Page 489 and 490:
6.133 Results of a long-term risk c
- Page 491 and 492:
6.135 TABLE 6.1.28. Operating Costs
- Page 493 and 494:
6.137 REACTORS Domestic Civilian F
- Page 495 and 496:
HLW From Fuel Processing Facility 6
- Page 497 and 498:
° 6.141 OTV/ORBIT 0.85 AU INSERTIO
- Page 499 and 500:
6.143 Waste Form. The waste form wo
- Page 501 and 502:
Implementation Time 6.145 With the
- Page 503 and 504:
6.147 (Bechtel 1979a). (See Table 6
- Page 505 and 506:
6.149 Regarding on- or near-pad acc
- Page 507 and 508:
6.151 * Public Sector.Economy. Curr
- Page 509 and 510:
6.153 * "Treaty on Principles Gover
- Page 511 and 512:
6.155 charges to DOE as a Space Shu
- Page 513 and 514:
6.157 Bell, W. J. 1971. An Analysis
- Page 515 and 516:
6.159 Environmental Protection Agen
- Page 517 and 518:
6.161 Lynn, R. D. and Z. E. Arlin.
- Page 519 and 520:
6.163 Sandia Laboratories. 1980. Su
- Page 521 and 522:
6.165 6.2 COMPARISON OF ALTERNATIVE
- Page 523 and 524:
6.167 fuel assemblies would be appr
- Page 525 and 526:
6.169 A reprocessing fuel cycle wou
- Page 527 and 528:
6.2.1.9 Space 6.171 In the space di
- Page 529 and 530:
Radiological Effects 6.173 TABLE 6.
- Page 531 and 532:
Non-Radiological Environmental Effe
- Page 533 and 534:
6.177 6.2.2.7 Long-Term Maintenance
- Page 535 and 536:
6.179 deep hole, island mined repos
- Page 537 and 538:
6.181 6.2.3.4 The Concept Should be
- Page 539 and 540:
Timing 6.183 The timing of implemen
- Page 541 and 542:
TABLE 6.2.6. Performance of Propose
- Page 543 and 544:
6.187 As discussed in Section 6.2.1
- Page 545 and 546:
6.189 design might well be limited
- Page 547 and 548:
6.191 6.2.4.4 Conformance with Fede
- Page 549 and 550:
6.193 appears not to significantly
- Page 551 and 552:
TABLE 6.2.8. Estimated Resource Com
- Page 553 and 554:
6.197 space disposal in an intermed
- Page 555 and 556:
REFERENCES FOR SECTION 6.2 6.199 Co
- Page 557 and 558:
6.2 annual throughput or a common e
- Page 559 and 560:
6.4 are identified for well injecti
- Page 561 and 562:
6.1.1.1 Concept Summary 6.6 6.1.1 V
- Page 563 and 564:
6.8 Recycle Geologic Facilitie UF6
- Page 565 and 566:
6.10 The canister would have to pro
- Page 567 and 568:
6.12 storage facility (Bechtel 1979
- Page 569 and 570:
6.14 Sealing. Standard oil field pr
- Page 571 and 572:
6.16 thermomechanical behavior woul
- Page 573 and 574:
6.18 Remote determinations of water
- Page 575 and 576:
6.20 TABLE 6.1.2. VDH Concept - Occ
- Page 577 and 578:
6.22 available at this time. Parame
- Page 579 and 580:
Potential Events 6.24 TABLE 6.1.6.
- Page 581 and 582:
6.26 TABLE 6.1.7. Long-Term Radiolo
- Page 583 and 584:
6.1.2.1 Concept Summary 6.28 6.1.2
- Page 585 and 586:
Waste-Type Compatibility 6.30 It is
- Page 587 and 588:
6.32 Predisposal Treatment of the W
- Page 589 and 590:
6.34 be: (1) the pipe and valve man
- Page 591 and 592:
6.36 The heat effects in the periph
- Page 593 and 594:
6.38 the necessary leaktightness of
- Page 595 and 596:
6.40 Data Base Development. Develop
- Page 597 and 598:
6.42 Radiological Impacts. During p
- Page 599 and 600:
6.44 1979a). In addition, with colo
- Page 601 and 602:
6.46 would be stored as a liquid, i
- Page 603 and 604:
6.1.3.1 Concept Summary 6.48 6.1.3
- Page 605 and 606:
Reactors 6.50 -|LWR| Waste Sources
- Page 607 and 608:
6.52 Precipitation Surface Faciliti
- Page 609 and 610:
6.54 6.1.3.3 Status of Technical De
- Page 611 and 612:
6.56 Moreover, although transportat
- Page 613 and 614:
6.58 International and Domestic Leg
- Page 615 and 616:
Sea Water Dilution 6.60 Discharge I
- Page 617 and 618:
6.1.4.1 Concept Summary 6.62 6.1.4
- Page 619 and 620:
Reactors 6.64 Waste Sources IF L W
- Page 621 and 622:
6.66 The ocean's benthic boundary l
- Page 623 and 624:
6.68 The total seabed area required
- Page 625 and 626:
6.70 Ion Transport in the Sediment.
- Page 627 and 628:
6.72 The SDP program plan has been
- Page 629 and 630:
6.74 TABLE 6.1.12. Estimated Dose C
- Page 631 and 632:
6.76 TABLE 6.1.13. Estimated Energy
- Page 633 and 634:
6.78 food chains and ultimate consu
- Page 635 and 636:
6.80 processed and disposed of, and
- Page 637 and 638:
6.1.5.1 Concept Summary 6.82 6.1.5
- Page 639 and 640:
6.84 Because the options for the wa
- Page 641 and 642:
Reprocessing Plant 6.86 Shielded Ce
- Page 643 and 644:
6.88 ,An important factor in this c
- Page 645 and 646:
6.90 * Radioactivity of water at ic
- Page 647 and 648:
6.92 Occupational casualties from t
- Page 649 and 650:
6.94 glass, before transportation t
- Page 651 and 652:
6.96 Specific areas of concern, as
- Page 653 and 654:
6.98 TABLE 6.1.17. Capital Costs Fo
- Page 655 and 656:
6.1.6.1 Concept Summary 6.100 6.1.6
- Page 657 and 658:
6.102 cases, the injection liquid w
- Page 659 and 660:
6.104 heated to above 100 C) (EPA 1
- Page 661 and 662:
6.106 capabilities, primarily perfo
- Page 663 and 664:
6.108 volume of geologic data (stra
- Page 665 and 666:
6.110 With the basic technology for
- Page 667 and 668:
Summary 6.112 Major uncertainties,
- Page 669 and 670:
Natural System Impacts 6.114 Effect
- Page 671 and 672:
6.116 natural gas storage, freshwat
- Page 673 and 674:
6.118 for a facility to perform rem
- Page 675 and 676:
Reactors 6.120 -- ILWRl Waste Sourc
- Page 677 and 678:
Predisposal Treatment 6.122 In a fu
- Page 679 and 680:
6.124 * The use of commercial power
- Page 681 and 682:
6.126 6.1.7.4 Impacts of Constructi
- Page 683 and 684:
6.128 TABLE 6.1.23. Occupational Ra
- Page 685 and 686:
6.130 TABLE 6.1.26. Summary Effects
- Page 687 and 688:
6.132 waste treatment facility woul
- Page 689 and 690:
6.134 more than 100 times for fresh
- Page 691 and 692:
6.1.8.1 Concept Summary 6.136 6.1.8
- Page 693 and 694:
6.138 quirements, high costs, and p
- Page 695 and 696:
6.140 The shielded waste container
- Page 697 and 698:
6.142 Retrievability/Recovery. Unti
- Page 699 and 700:
6.144 Rescue Technology. Remote aut
- Page 701 and 702:
6.146 6.1.8.4 Impacts of Constructi
- Page 703 and 704:
6.148 TABLE 6.1.30 Short Term (Pree
- Page 705 and 706:
6.150 In general, normal operation
- Page 707 and 708:
6.152 Critical Resources. Estimated
- Page 709 and 710:
6.154 The potential hazard from the
- Page 711 and 712:
REFERENCES FOR SECTION 6.1 6.156 Aa
- Page 713 and 714:
6.158 Cohen, J. J. et al. 1972. "In
- Page 715 and 716:
6.160 Holilster, J. C. and R. J. We
- Page 717 and 718:
6.162 Pardue, W. M. 1977. Prelimina
- Page 719 and 720:
6.164 White, D. E. 1965. "Saline Wa
- Page 721 and 722:
6.166 TABLE 6.2.1. Disposition of P
- Page 723 and 724:
6.168 Spent fuel assemblies would b
- Page 725 and 726:
6.170 A waste processing facility w
- Page 727 and 728:
S\ 6.172 the spectrum of waste prod
- Page 729 and 730:
6.174 unit of electrical power by n
- Page 731 and 732:
6.176 policies" suggesting that con
- Page 733 and 734:
6.178 6.2.3 Application of Performa
- Page 735 and 736:
6.180 factory performance of the is
- Page 737 and 738:
6.182 development of methods for pr
- Page 739 and 740:
6.184 standard of judgement as to p
- Page 741 and 742:
6.186 tion of facilities. The failu
- Page 743 and 744:
6.188 The mined repository and very
- Page 745 and 746:
6.190 relative to waste treatment a
- Page 747 and 748:
TABLE 6.2.7. Estimated costs of Var
- Page 749 and 750:
6.194 hole concept following packag
- Page 751 and 752:
Radiological Effects TABLE 6.2.9. S
- Page 753 and 754:
6.2.5.4 Space Disposal 6.198 The pr
- Page 755 and 756:
7.1 CHAPTER 7 SYSTEM IMPACTS OF PRO
- Page 757 and 758:
7.3 adoption of this strategy was t
- Page 759 and 760:
7.5 these low-growth conditions. Th
- Page 761 and 762:
7.7 By combining the ORIGEN to matc
- Page 763 and 764:
7.9 Four types of waste management
- Page 765 and 766:
7.3 SYSTEM LOGISTICS 7.11 To develo
- Page 767 and 768:
7.13 7.3.1 Repository Inventory Acc
- Page 769 and 770:
250 200- 150 100 - 2 _ 50- 250 1990
- Page 771 and 772:
E 400 7.17 DCASE 5 S/ CASE 4 S300 z
- Page 773 and 774:
7.19 TABLE 7.3.2. Comparison of Awa
- Page 775 and 776:
7.21 wastes do become substantial f
- Page 777 and 778:
TABLE 7.3.6. Comparison of Total Tr
- Page 779 and 780:
7.25 TABLE 7.3.8. Maximum (and mini
- Page 781 and 782:
7.27 The number of equivalent 30-ye
- Page 783 and 784:
7.29 TABLE 7.3.10. Number of 800-he
- Page 785 and 786:
TABLE 7.3.12. Plutonium Disposition
- Page 787 and 788:
TABLE 7.3.13. Total Radioactivity I
- Page 789 and 790:
7.35 reprocessing cycle wastes are
- Page 791 and 792:
7.37 TABLE 7.3.18 Principal Contrib
- Page 793 and 794:
7.39 TABLE 7.4.2 Comparison of 70-Y
- Page 795 and 796:
7.41 for discrimination in the sele
- Page 797 and 798:
7.43 TABLE 7.5.1 Resource Commitmen
- Page 799 and 800:
TABLE 7.5.3 Comparison of Relative
- Page 801 and 802:
7.47 1980). (This schedule actually
- Page 803 and 804:
7.49 TABLE 7.6.4. Comparison of Lev
- Page 805 and 806:
7.51 TABLE 7.6.8. Comparison of Lev
- Page 807 and 808:
7.53 Unit costs for the present inv
- Page 809 and 810:
8.1 CHAPTER 8 GLOSSARY OF KEY TERMS
- Page 811 and 812:
8.3 Cask: A container that provides
- Page 813 and 814:
FPF: Fuel packaging facility. 8.5 F
- Page 815 and 816:
8.7 Kaolinite: A common clay consis
- Page 817 and 818:
8.9 Primary Wastes: Untreated initi
- Page 819 and 820:
8.11 Transportation: Movement of ma
- Page 821 and 822:
iii VOLUME 2 CONTENTS APPENDIX A -
- Page 823 and 824:
V CONTENTS (contd) K.2 REMOVAL OF E
- Page 825 and 826:
vii FIGURES (contd) K.1.11 Very-Nea
- Page 827 and 828:
ix TABLES (contd) A.1.20 Spent Fuel
- Page 829 and 830:
xi TABLES (contd) A.3.9b Heat Gener
- Page 831 and 832:
xi11 TABLES (contd) A.9.3c Reposito
- Page 833 and 834:
xv TABLES (contd) P.2.4 Uranyl Phos
- Page 835 and 836:
TABLE A.1.1. Spent Fuel Logistics f
- Page 837 and 838:
TABLE A.1.3. Spent Fuel Logistics f
- Page 839 and 840:
TABLE A.1.5. Spent Fuel Logistics f
- Page 841 and 842:
TABLE A.1.7. Spent Fuel Logistics f
- Page 843 and 844:
TABLE A.1.9. Spent Fuel Logistics f
- Page 845 and 846:
A. 12 TABLE A.1.11. Spent Fuel Logi
- Page 847 and 848:
A.14 TABLE A.1.13. Spent Fuel Logis
- Page 849 and 850:
A.16 TABLE A.1.15. Spent Fuel Logis
- Page 851 and 852:
TABLE A.1.16. (Contd) REPOSITo0R SH
- Page 853 and 854:
TABLE A.1.17. (Contd) RFPPnrESS RSI
- Page 855 and 856:
TABLE A.1.18. (Contd) FPanCnr.EsS Y
- Page 857 and 858:
TABLE A.1.19. (Contd) cFPonrES StHI
- Page 859 and 860:
TABLE A.1.20. (Contd) RA*CTO9 YEAP
- Page 861 and 862:
TABLE A.1.22. Number of Containers
- Page 863 and 864:
A.2 RADIOACTIVE INVENTORY TABLES A.
- Page 865 and 866:
TABLE A.2.1b. Radioactivity Invento
- Page 867 and 868:
TABLE A.2.2b. Radioactivity Invento
- Page 869 and 870:
TABLE A.2.3b. Radioactivity Invento
- Page 871 and 872:
TABLE A.2.4b. Radioactivity Invento
- Page 873 and 874:
TABLE A.2.5b. Radioactivity Invento
- Page 875 and 876:
TABLE A.2.6b. Radioactivity Invento
- Page 877 and 878:
TABLE A.2.7b. Radioactivity Invento
- Page 879 and 880:
TABLE A.2.8b. Radioactivity Invento
- Page 881 and 882:
TABLE A.2.9b. Radioactivity Invento
- Page 883 and 884:
TABLE A.3.la. Heat Generation Rates
- Page 885 and 886:
TABLE A.3.2a. Heat Generation Rates
- Page 887 and 888:
TABLE A.3.3a. Heat Generation Rates
- Page 889 and 890:
TABLE A.3.4a. Heat Generation Rates
- Page 891 and 892:
TABLE A.3.5a. Heat'Generation Rates
- Page 893 and 894:
TABLE A.3.6a. Heat Generation Rates
- Page 895 and 896:
TABLE A.3.7a. Heat Generation Rates
- Page 897 and 898:
TABLE A.3.8a. Heat Generation Rates
- Page 899 and 900:
TABLE A.3.9a. Heat Generation Rates
- Page 901 and 902:
A.4' HAZARD INDEX TABLES A.68 The t
- Page 903 and 904:
A.70 TABLE A.4.1b. Hazard Index--On
- Page 905 and 906:
A. 72 TABLE A.4.2b. Hazard Index--O
- Page 907 and 908:
A.74 TABLE A.4.3b. Hazard Index--On
- Page 909 and 910:
A.76 TABLE A.4.4b. Hazard:Index--On
- Page 911 and 912:
A. 78 TABLE A.4.5b. Hazard Index--O
- Page 913 and 914:
A.80 TABLE A.4.6b. Hazard Index--Re
- Page 915 and 916:
A.82 TABLE A.4.7b. Hazard Index--Re
- Page 917 and 918:
A. 84 TABLE A.4.8b. Hazard Index--R
- Page 919 and 920:
A.86 TABLE A.4.9b. Hazard Index--Re
- Page 921 and 922:
A.88 TABLE A.5.la. Whole-Body Dose
- Page 923 and 924:
TABLE A.5.2a. Whole-Body Dose to th
- Page 925 and 926:
A.6 RESOURCE COMMITMENTS A.92 Resou
- Page 927 and 928:
TABLE A.6.2. Resource Commitments w
- Page 929 and 930:
A.7 TRANSPORTATION REQUIREMENTS A.9
- Page 931 and 932:
TABLE A.7.2. Transportation Require
- Page 933 and 934:
TABLE A.8.1. Cost Estimates for Tre
- Page 935 and 936:
A. 102 TABLE A.8.3. Cost Estimates
- Page 937 and 938:
A.9 SUPPLEMENTARY SYSTEM COST DATA
- Page 939 and 940:
TABLE A.9.1b. Allocation of Total-S
- Page 941 and 942:
TABLE A.9.2a. Allocation of Total-S
- Page 943 and 944:
TABLE A.9.2c. Allocation of Total-S
- Page 945 and 946:
TABLE A.9.3b. Repository Media Effe
- Page 947 and 948:
TABLE A.9.4a. Repository Media Effe
- Page 949 and 950:
TABLE A.9.4c. Repository Media Effe
- Page 951 and 952:
A.118 TABLE A.9.6. Estimated Resear
- Page 953 and 954:
TABLE A.10.1. Repository Requiremen
- Page 955 and 956:
B.1 APPENDIX B GEOLOGIC DISPOSAL SU
- Page 957 and 958:
B.3 Erosion by wind energy is a mec
- Page 959 and 960:
B.5 properties. The emplacement med
- Page 961 and 962:
B.7 Rocks are named and described a
- Page 963 and 964:
B.9 Through isotopic ratio dating,
- Page 965 and 966:
B.4 HYDROLOGIC CONSIDERATIONS B.11
- Page 967 and 968:
B.13 and the field measurement of h
- Page 969 and 970:
B.6 MULTIPLE GEOLOGIC BARRIERS B.15
- Page 971 and 972:
8.17 Salt deposit structures can be
- Page 973 and 974: B.19 TABLE B.6.1. Average Chemical
- Page 975 and 976: B.7 THE SITE SELECTION PROCESS B.21
- Page 977 and 978: B.23 CANDIDATE REGIONS FROM STAGE I
- Page 979 and 980: B.25 CONTINENTAL U.S. STAGE I DATA
- Page 981 and 982: B.27 Office of Waste Isolation. 197
- Page 983 and 984: C.2 the year of intake, and charge
- Page 985 and 986: C.2 DERIVED LIMITS AND ACTION LEVEL
- Page 987 and 988: C.6 boundary (e.g., evacuation). Th
- Page 989 and 990: C.8 Taylor, L. S. 1973. The Origin
- Page 991 and 992: D.2 employed here except that the p
- Page 993 and 994: 0.4 and 75 radionuclides. A summary
- Page 995 and 996: D.6 farther than 2600 ft is negligi
- Page 997 and 998: D.8 Baker's analysis indicated that
- Page 999 and 1000: D.2.2.1 Dose Conversion Factors for
- Page 1001 and 1002: D.12 The concentration during the n
- Page 1003 and 1004: REFERENCES FOR APPENDIX D D.14 Atom
- Page 1005 and 1006: E.1 APPENDIX E RADIOLOGICALLY RELAT
- Page 1007 and 1008: warrants use in determining public
- Page 1009 and 1010: E.5 The Reactor Safety Study(a) (RS
- Page 1011 and 1012: E.2 GENETIC EFFECTS E.! It is known
- Page 1013 and 1014: E.3 CONCLUSIONS E.9 For this Statem
- Page 1015 and 1016: E.11 TABLE E.4.1. Comparison of Tra
- Page 1017 and 1018: E.13 E.6 SPECIFIC CONSIDERATION OF
- Page 1019 and 1020: E.15 In summary, it may be conclude
- Page 1021 and 1022: REFERENCES FOR APPENDIX E E.17 Atom
- Page 1023: E.19 Shtukkenberg, Y. M. 1968. "Phy
- Page 1027 and 1028: F.3 GEOLOGY F.4 The area in which t
- Page 1029 and 1030: 70 600 - 150 500 - F.6 40 =30 20 CL
- Page 1031 and 1032: F.5 METEOROLOGY F.8 The general cli
- Page 1033 and 1034: F.10 F.6 PATHWAY PARAMETERS RELEVAN
- Page 1035 and 1036: G.1 APPENDIX G REFERENCE SITES FOR
- Page 1037 and 1038: Population G.3 Table G.2.1 Selected
- Page 1039 and 1040: H.1 APPENDIX H HAZARD INDICES The t
- Page 1041 and 1042: H.3 number of MPI in the environmen
- Page 1043 and 1044: H.5 Rochlin, G. I. 1977. "Nuclear W
- Page 1045 and 1046: Defense HLW(b) TABLE I.1.1. Compari
- Page 1047 and 1048: Defense TRU Waste On hand as of Sep
- Page 1049 and 1050: K.1 THERMAL CRITERIA K.1 APPENDIX K
- Page 1051 and 1052: subsequent precipitation of mineral
- Page 1053 and 1054: K.5 Step 5: Make near-field rock me
- Page 1055 and 1056: K.7 TABLE K.1.2. Thermal Load Limit
- Page 1057 and 1058: K.9 TABLE K.1.4 Thermal Loadings Ac
- Page 1059 and 1060: K.11 TEMPERATURE VS. DEPTH 400 -.-.
- Page 1061 and 1062: K.13 TEMPERATURE VS. DEPTH 400 --.
- Page 1063 and 1064: 600 - K.15 TEMPERATURE VS. TIME 6.5
- Page 1065 and 1066: K.17 TEMPERATURE VS. TIME 6.5 YR. O
- Page 1067 and 1068: K.19 TABLE K.1.7. Thermal Loading L
- Page 1069 and 1070: K.21 TABLE K.1.11. Maximum Near-Fie
- Page 1071 and 1072: K.2 REMOVAL OF EMPLACED WASTE K.23
- Page 1073 and 1074: K.25 K.2.2 Recoverable Emplacement
- Page 1075 and 1076:
K.27 TABLE K.3.1. Predominant Solut
- Page 1077 and 1078:
K.29 TABLE K.3.4 Retention Time Ran
- Page 1079 and 1080:
K.31 Neretnieks, I. 1977. Retardati
- Page 1081 and 1082:
USGS/LASL-SLA L.2 Evaluation of the
- Page 1083 and 1084:
L.2 HOST ROCK PROPERTIES L.4 Resear
- Page 1085 and 1086:
L.3 THERMAL AND RADIATION EFFECTS L
- Page 1087 and 1088:
Glossary of Acronyms Used in Append
- Page 1089 and 1090:
M.I APPENDIX M. BIBLIOGRAPHY FOR SE
- Page 1091 and 1092:
M.3 Bryant, E. A. et al. 1976. Oklo
- Page 1093 and 1094:
M.5 Department of Energy (DOE). 197
- Page 1095 and 1096:
M.7 Gorrell, T. C. 1979. Transmutat
- Page 1097 and 1098:
Loeding, J. W. 1961. The Fluid Bed
- Page 1099 and 1100:
M. 1 National Academy of Sciences (
- Page 1101 and 1102:
M.13 Roberts, J. J. et al. 1978. Pl
- Page 1103 and 1104:
M.15 Thompson, G. H. et al. 1979. A
- Page 1105 and 1106:
N.1 APPENDIX N WASTES FROM THORIUM-
- Page 1107 and 1108:
N.3 operation used to separate the
- Page 1109 and 1110:
P.1 APPENDIX P MINERALS THAT COULD
- Page 1111 and 1112:
P.3 One can usually establish only
- Page 1113 and 1114:
P.5 * pH. Most minerals are leached
- Page 1115 and 1116:
Element minerals P.7 TABLE P.1.4 Pl
- Page 1117 and 1118:
P.1.2.1 Leaching rate P.9 If the le
- Page 1119 and 1120:
P.11 Using Table P.1.6 as a guide,
- Page 1121 and 1122:
P.13 * firing the calcine, at tempe
- Page 1123 and 1124:
P.15 The reported rare earth conten
- Page 1125 and 1126:
P.17 Although the pure di-calcium s
- Page 1127 and 1128:
P.19 aluminosilicate framework stru
- Page 1129 and 1130:
P.21 The stability of this group of
- Page 1131 and 1132:
P.23 close association with albite,
- Page 1133 and 1134:
P.25 complex carbonates of the alka
- Page 1135 and 1136:
P.27 Ca(P04)3(0H) + 4H + - 5Ca 2+ +
- Page 1137 and 1138:
P.29 Xenotime contains a high amoun
- Page 1139 and 1140:
P.2.6.2 Uranate Minerals P.31 Urani
- Page 1141 and 1142:
P.33 depending on the number of wat
- Page 1143 and 1144:
P.3 MINERAL TABLES P.35 P.3.1 Hosts
- Page 1145 and 1146:
P.37 TABLE P.3.1. (continued) Occur
- Page 1147 and 1148:
P.39 TABLE P.3.1. (continued) Occur
- Page 1149 and 1150:
P.41 TABLE P.3.1. (continued) Occur
- Page 1151 and 1152:
P.43 The rankings, except for the t
- Page 1153 and 1154:
P.45 Koreskawa 1954) and differenti
- Page 1155 and 1156:
P.47 uranium or thorium. Reports of
- Page 1157 and 1158:
REFERENCES FOR APPENDIX P P.49 Alex
- Page 1159 and 1160:
P.51 Mitchell, R. S. 1972.. "Virgin
- Page 1161 and 1162:
FINAL DOE/EIS-0046F Volume 3 of 3 U
- Page 1163 and 1164:
SAFEGUARDS GROWTH SCENARIOS GEOLOGI
- Page 1165 and 1166:
2 POLICY TOPIC AREAS KEY ISSUES . R
- Page 1167 and 1168:
4 Volume 2 Section of Final Stateme
- Page 1169 and 1170:
Issues 6 WASTE PROGRAM Several comm
- Page 1171 and 1172:
8 WASTE PROGRAM * The multibarrier
- Page 1173 and 1174:
Response 10 WASTE PROGRAM The objec
- Page 1175 and 1176:
Issue 12 LICENSING AND THE DECISION
- Page 1177 and 1178:
14 LICENSING AND THE DECISION-MAKIN
- Page 1179 and 1180:
Response 16 SITING ISSUES While the
- Page 1181 and 1182:
Response 18 SITING ISSUES In keepin
- Page 1183 and 1184:
Issues 20 FUEL CYCLE ISSUES Several
- Page 1185 and 1186:
Issue 22 ATTRIBUTION OF COSTS/RISKS
- Page 1187 and 1188:
24 GENERAL COMMENTS In addition to
- Page 1189 and 1190:
Draft p. iv Issue 26 ORGANIZATION A
- Page 1191 and 1192:
Issue 28 ORGANIZATION AND PRESENTAT
- Page 1193 and 1194:
Section of Final Statement 30 ORGAN
- Page 1195 and 1196:
Response 32 ORGANIZATION AND PRESEN
- Page 1197 and 1198:
Draft pp. iv and 1.2 Issue 34 SCOPE
- Page 1199 and 1200:
Response 5.2). Issue 36 SCOPE Such
- Page 1201 and 1202:
(167) 38 SCOPE The problems or cost
- Page 1203 and 1204:
40 RADIOLOGICAL ISSUES presently re
- Page 1205 and 1206:
Draft p. 2.2.3 Issue 42 RADIOLOGICA
- Page 1207 and 1208:
Draft p. 2.3.3 Issue 44 RADIOLOGICA
- Page 1209 and 1210:
46 RADIOLOGICAL ISSUES particles (h
- Page 1211 and 1212:
48 RADIOLOGICAL ISSUES it has been
- Page 1213 and 1214:
Draft p. 3.1.144 Issue 50 RADIOLOGI
- Page 1215 and 1216:
Draft Appendix C Issue 52 RADIOLOGI
- Page 1217 and 1218:
Response 54 RADIOLOGICAL ISSUES EPA
- Page 1219 and 1220:
56 RADIOLOGICAL ISSUES The EPA risk
- Page 1221 and 1222:
58 RADIOLOGICAL ISSUES Transuranium
- Page 1223 and 1224:
60 RADIOLOGICAL ISSUES BEIR III (19
- Page 1225 and 1226:
62 CONSEQUENCE ANALYSIS Risk define
- Page 1227 and 1228:
64 CONSEQUENCE ANALYSIS Sr and Cs h
- Page 1229 and 1230:
66 CONSEQUENCE ANALYSIS individual
- Page 1231 and 1232:
Response 68 CONSEQUENCE ANALYSIS Th
- Page 1233 and 1234:
70 CONSEQUENCE ANALYSIS been provid
- Page 1235 and 1236:
72 CONSEQUENCE.ANALYSIS on a sound
- Page 1237 and 1238:
Response 74 CONSEQUENCE ANALYSIS DO
- Page 1239 and 1240:
Draft p. 3.1.100 Issue 76 CONSEQUEN
- Page 1241 and 1242:
Draft p. 3.1.123 Issue 78 CONSEQUEN
- Page 1243 and 1244:
80 CONSEQUENCE ANALYSIS demonstrate
- Page 1245 and 1246:
82 CONSEQUENCE ANALYSIS The followi
- Page 1247 and 1248:
Response 84 iCONSEQUENCE ANALYSIS T
- Page 1249 and 1250:
Draft pp. 3.1.148-155 Issue ,86 CON
- Page 1251 and 1252:
Draft p. 3.1.155 Issue 88 CONSEQUEN
- Page 1253 and 1254:
Draft pp. 3.1.165-168 Issue 90 CONS
- Page 1255 and 1256:
92 CONSEQUENCE ANALYSIS Note the as
- Page 1257 and 1258:
94 CONSEQUENCE ANALYSIS are found i
- Page 1259 and 1260:
96 CONSEQUENCE ANALYSIS Briefly, th
- Page 1261 and 1262:
98 CONSEQUENCE ANALYSIS rates to be
- Page 1263 and 1264:
Response 100 CONSEQUENCE ANALYSIS T
- Page 1265 and 1266:
102 CONSEQUENCE ANALYSIS in additio
- Page 1267 and 1268:
104 CONSEQUENCE ANALYSIS Three sour
- Page 1269 and 1270:
106 CONSEQUENCE ANALYSIS would depe
- Page 1271 and 1272:
Issue 108 CONSEQUENCE ANALYSIS A qu
- Page 1273 and 1274:
Response 110 CONSEQUENCE ANALYSIS A
- Page 1275 and 1276:
Response 112 CONSEQUENCE ANALYSIS T
- Page 1277 and 1278:
Issue 114 DOSE CALCULATIONS Several
- Page 1279 and 1280:
Draft p. 1.20 Issue 116 DOSE CALCUL
- Page 1281 and 1282:
Response 118 DOSE CALCULATIONS In p
- Page 1283 and 1284:
Response 120 DOSE CALCULATIONS Dilu
- Page 1285 and 1286:
Response 122 DOSE CALCULATIONS The
- Page 1287 and 1288:
Response 124 DOSE CALCULATIONS The
- Page 1289 and 1290:
Response 126 DOSE CALCULATIONS The
- Page 1291 and 1292:
Issue 128 RISK PERSPECTIVES Several
- Page 1293 and 1294:
Response 130 RISK PERSPECTIVES * Th
- Page 1295 and 1296:
132 RISK PERSPECTIVES Draft p. 1.16
- Page 1297 and 1298:
Draft p. 3.1.64 Issue 134 RISK PERS
- Page 1299 and 1300:
Draft Appendix H Issue 136 RISK PER
- Page 1301 and 1302:
Response 138 RISK PERSPECTIVES EPA
- Page 1303 and 1304:
Draft p. 3.1.55 Issue 140 WASTE MAN
- Page 1305 and 1306:
Response 142 WASTE MANAGEMENT OPERA
- Page 1307 and 1308:
Response 144 WASTE MANAGEMENT OPERA
- Page 1309 and 1310:
14,6 WASTE MANAGEMENT OPERATIONS To
- Page 1311 and 1312:
Response 148 -WASTE MANAGEMENT OPER
- Page 1313 and 1314:
Response 150 WASTE MANAGEMENT OPERA
- Page 1315 and 1316:
Draft p. 3.1.90 Issue 152 WASTE MAN
- Page 1317 and 1318:
Response 1.54 WASTE MANAGEMENT OPER
- Page 1319 and 1320:
156 WASTE MANAGEMENT OPERATIONS AFR
- Page 1321 and 1322:
Draft p. 3.1.85 Issue 158 WASTE MAN
- Page 1323 and 1324:
Response 160 WASTE MANAGEMENT OPERA
- Page 1325 and 1326:
Draft pp. 1.11 Issue 162 WASTE MANA
- Page 1327 and 1328:
164 WASTE MANAGEMENT OPERATIONS whi
- Page 1329 and 1330:
166 WASTE MANAGEMENT OPERATIONS and
- Page 1331 and 1332:
168 WASTE MANAGEMENT OPERATIONS are
- Page 1333 and 1334:
Draft p. 1.4 Issue 170 WASTE MANAGE
- Page 1335 and 1336:
Draft p. 1.10 Issue 172 WASTE MANAG
- Page 1337 and 1338:
Response 174 WASTE MANAGEMENT OPERA
- Page 1339 and 1340:
Response 176 WASTE MANAGEMENT OPERA
- Page 1341 and 1342:
178 WASTE MANAGEMENT OPERATIONS Dra
- Page 1343 and 1344:
180 WASTE MANAGEMENT OPERATIONS 3.
- Page 1345 and 1346:
Draft p. 3.1.116 Issue 182 WASTE MA
- Page 1347 and 1348:
184 WASTE MANAGEMENT OPERATIONS sta
- Page 1349 and 1350:
DOE/ET-0028, pp. 7.4.43 and 7.5.46
- Page 1351 and 1352:
Draft pp. v and 3.1.6 Issue 188 FUE
- Page 1353 and 1354:
Draft pp 1.10, 1.23, 3.1.133 Issue
- Page 1355 and 1356:
192 COSTS 3. The construction cost
- Page 1357 and 1358:
Draft pp 3.1.210-212 Issue 194 COST
- Page 1359 and 1360:
196 COSTS Title Basin Size Cost Est
- Page 1361 and 1362:
Issue 198 COSTS An issue which need
- Page 1363 and 1364:
200 SAFEGUARDS For the waste in the
- Page 1365 and 1366:
202 SAFEGUARDS planning for assista
- Page 1367 and 1368:
Draft pp. 1.10 and 2.1.2 Issue 204
- Page 1369 and 1370:
Draft, p. 1.3 Issue (208-NRC) Respo
- Page 1371 and 1372:
Draft pp. 1.12 and 3.1.32 Issue 208
- Page 1373 and 1374:
Response 210 GEOLOGIC CONSIDERATION
- Page 1375 and 1376:
Draft pp. 1.14 and 3.1.11 Issue 212
- Page 1377 and 1378:
214 GEOLOGIC CONSIDERATIONS in thes
- Page 1379 and 1380:
216 GEOLOGIC CONSIDERATIONS The rev
- Page 1381 and 1382:
Draft p. 3.1.4 Issue 218 GEOLOGIC C
- Page 1383 and 1384:
Draft p. 3.1.5 Issue 220 GEOLOGIC C
- Page 1385 and 1386:
Draft p. 3.1.6 Issue 222 GEOLOGIC C
- Page 1387 and 1388:
Draft p. 3.1.8 Issue (113-EPA) Resp
- Page 1389 and 1390:
226 GEOLOGIC CONSIDERATIONS composi
- Page 1391 and 1392:
Response 228 GEOLOGIC CONSIDERATION
- Page 1393 and 1394:
Response 230 GEOLOGIC CONSIDERATION
- Page 1395 and 1396:
232 GEOLOGIC CONSIDERATIONS 5. Figu
- Page 1397 and 1398:
Draft p. 3.1.20 Issue 234 GEOLOGIC
- Page 1399 and 1400:
Draft p. 3.1.23 Issue 236 GEOLOGIC
- Page 1401 and 1402:
Draft pp. 3.1.24, 33 and 235 Issue
- Page 1403 and 1404:
Response 240 GEOLOGIC CONSIDERATION
- Page 1405 and 1406:
242 GEOLOGIC CONSIDERATIONS selecti
- Page 1407 and 1408:
244 GEOLOGIC CONSIDERATIONS The Tek
- Page 1409 and 1410:
Response The text was changed. Draf
- Page 1411 and 1412:
Response 248 GEOLOGIC CONSIDERATION
- Page 1413 and 1414:
Response 250 GEOLOGIC CONSIDERATION
- Page 1415 and 1416:
252 GEOLOGIC CONSIDERATIONS made. T
- Page 1417 and 1418:
Draft p. 3.1.124 Issue 254 GEOLOGIC
- Page 1419 and 1420:
256 GEOLOGIC CONSIDERATIONS effects
- Page 1421 and 1422:
Response 258 GEOLOGIC CONSIDERATION
- Page 1423 and 1424:
260 GEOLOGIC CONSIDERATIONS be mapp
- Page 1425 and 1426:
262 GEOLOGIC CONSIDERATIONS tectoni
- Page 1427 and 1428:
264 GEOLOGIC CONSIDERATIONS Since e
- Page 1429 and 1430:
Issue 266 GEOLOGIC CONSIDERATIONS S
- Page 1431 and 1432:
Issue 268 GEOLOGIC CONSIDERATIONS I
- Page 1433 and 1434:
270 GEOLOGIC CONSIDERATIONS the Nev
- Page 1435 and 1436:
Draft p. 3.1.6 Issue 272 MULTIBARRI
- Page 1437 and 1438:
Draft p. 3.1.40 Issue 274 MULTIBARR
- Page 1439 and 1440:
Draft p. 3.1.55 Issue 276 MULTIBARR
- Page 1441 and 1442:
Draft p. 3.1.61 Issue 278 MULTIBARR
- Page 1443 and 1444:
Draft Appendix L Issue 280 MULT.IBA
- Page 1445 and 1446:
282 MULTIBARRIERS FOR DISPOSAL cont
- Page 1447 and 1448:
Draft p. 1.6 Issue 284 SOCIOECONOMI
- Page 1449 and 1450:
Draft p. 3.1.25 Issue 286 SOCIOECON
- Page 1451 and 1452:
Draft p. 3.1.75 Issue 288 SOCIOECON
- Page 1453 and 1454:
290 SOCIOECONOMIC/SOCIOPOLITICAL IS
- Page 1455 and 1456:
292 SOCIOECONOMIC/SOCIOPOLITICAL IS
- Page 1457 and 1458:
294 RESOURCE REQUIREMENTS a site sp
- Page 1459 and 1460:
Response REFERENCE ENVIRONMENTS DOE
- Page 1461 and 1462:
Response 298 REFERENCE ENVIRONMENTS
- Page 1463 and 1464:
Draft pp. 1.1, 31, 35, 36 Issue 300
- Page 1465 and 1466:
302 COMPARATIVE ASSESSMENT 2. To st
- Page 1467 and 1468:
304 COMPARATIVE ASSESSMENT Draft p.
- Page 1469 and 1470:
Response 306 COMPARATIVE ASSESSMENT
- Page 1471 and 1472:
Draft p. 4.9 Issue 308 COMPARATIVE
- Page 1473 and 1474:
Response 310 COMPARATIVE ASSESSMENT
- Page 1475 and 1476:
Response 312 COMPARATIVE ASSESSMENT
- Page 1477 and 1478:
314 ALTERNATIVE DISPOSAL CONCEPTS g
- Page 1479 and 1480:
316 ALTERNATIVE DISPOSAL CONCEPTS h
- Page 1481 and 1482:
Response 318 ALTERNATIVE DISPOSAL C
- Page 1483 and 1484:
Draft Appendix P Issue 320 ALTERNAT
- Page 1485 and 1486:
Draft p. 1.25 Issue 322 ALTERNATIVE
- Page 1487 and 1488:
Draft p. 3.3.7 Issue 324 ALTERNATIV
- Page 1489 and 1490:
Draft p. 3.3.30 Issue 326 ALTERNATI
- Page 1491 and 1492:
Draft p. 3.3.33 Issue 328 ALTERNATI
- Page 1493 and 1494:
Response 330. ALTERNATIVE DISPOSAL
- Page 1495 and 1496:
332 ALTERNATIVE DISPOSAL CONCEPTS A
- Page 1497 and 1498:
334 ALTERNATIVE DISPOSAL CONCEPTS D
- Page 1499 and 1500:
Draft p. 3.4.13 Issue Response 336
- Page 1501 and 1502:
Issue 338 ALTERNATIVE DISPOSAL CONC
- Page 1503 and 1504:
Draft Section 3.5 Issue 340 ALTERNA
- Page 1505 and 1506:
Response 342 ALTERNATIVE DISPOSAL C
- Page 1507 and 1508:
Draft p. 3.5.16 Issue 344 ALTERNATI
- Page 1509 and 1510:
346 ALTERNATIVE DISPOSAL CONCEPTS o
- Page 1511 and 1512:
348 ALTERNATIVE DISPOSAL CONCEPTS S
- Page 1513 and 1514:
Response 350 ALTERNATIVE DISPOSAL C
- Page 1515 and 1516:
Draft p. 1.27 Issue 352 ALTERNATIVE
- Page 1517 and 1518:
354 ALTERNATIVE DISPOSAL CONCEPTS W
- Page 1519 and 1520:
356 ALTERNATIVE DISPOSAL CONCEPTS e
- Page 1521 and 1522:
Response Jbb ALTERNATIVE DISPOSAL C
- Page 1523 and 1524:
Draft p. 3.6.4 Issue 360 ALTERNATIV
- Page 1525 and 1526:
Response 362 ALTERNATIVE DISPOSAL C
- Page 1527 and 1528:
Draft p. 3.6.6 Issue 364 ALTERNATIV
- Page 1529 and 1530:
Response 366 ALTERNATIVE DISPOSAL C
- Page 1531 and 1532:
368 ALTERNATIVE DISPOSAL CONCEPTS T
- Page 1533 and 1534:
Draft p. 3.6.18 Issue Response 37U
- Page 1535 and 1536:
Draft p. 3.6.21 Issue 372 ALTERNATI
- Page 1537 and 1538:
Draft p. 3.6.24 Issue 374 ALTERNATI
- Page 1539 and 1540:
Response 376 ALTERNATIVE DISPOSAL C
- Page 1541 and 1542:
Draft Section 3.7 Issue 378 ALTERNA
- Page 1543 and 1544:
Response 380 ALTERNATIVE DISPOSAL C
- Page 1545 and 1546:
Draft p. 3.7.9 Issue 382 ALTERNATIV
- Page 1547 and 1548:
Response 384 ALTERNATIVE DISPOSAL C
- Page 1549 and 1550:
386 ALTERNATIVE DISPOSAL CONCEPTS W
- Page 1551 and 1552:
Draft p. 3.8.2 Issue 388 ALTERNATIV
- Page 1553 and 1554:
Draft p. 3.8.10 Issue 390 ALTERNATI
- Page 1555 and 1556:
Response 392 ALTERNATIVE DISPOSAL C
- Page 1557 and 1558:
Response 394 ALTERNATIVE DISPOSAL C
- Page 1559 and 1560:
Response 396 ALTERNATIVE DISPOSAL C
- Page 1561 and 1562:
398 ALTERNATIVE DISPOSAL CONCEPTS T
- Page 1563 and 1564:
400 ALTERNATIVE DISPOSAL CONCEPTS E
- Page 1565 and 1566:
Draft p. 3.10.18 Issue 402 ALTERNAT
- Page 1567 and 1568:
Draft p. 3.10.27 Issue 404 ALTERNAT
- Page 1569 and 1570:
Response 406 ALTERNATIVE DISPOSAL C
- Page 1571 and 1572:
408 HEARING BOARD REPORT AND RESPON
- Page 1573 and 1574:
410 Safeguards of the Nuclear Regul
- Page 1575 and 1576:
HEARING BOARD REPORT ON THE DEPARTM
- Page 1577 and 1578:
Associated documents that came to t
- Page 1579 and 1580:
Further, this sole statement of pur
- Page 1581 and 1582:
Not even those in the scientific co
- Page 1583 and 1584:
A common misconception is that hole
- Page 1585 and 1586:
In sumnary, humanistic consideratio
- Page 1587 and 1588:
4. EDITORIAL AND TERMINOLOGICAL Res
- Page 1589 and 1590:
Several views of comparative risk n
- Page 1591 and 1592:
Resp-nse Various spent fuel storage
- Page 1593 and 1594:
Since current costs in developing a
- Page 1595 and 1596:
multiple barrier concept, they shou
- Page 1597 and 1598:
F. MISCELLMEOUS ITMS REQUIRING REVI
- Page 1599 and 1600:
III. CONCLUSIONS Subject to the abo
- Page 1601 and 1602:
, Draft Environmental Impact Staten
- Page 1603 and 1604:
440 Interagency Review Group. 1978.
- Page 1605 and 1606:
U.S. Nuclear Regulatory Commission.
- Page 1607 and 1608:
A.1 APPENDIX A LIST OF RESPONDENTS
- Page 1609 and 1610:
A.3 COMMENTER DATE RECEIVED 12. Ms.
- Page 1611 and 1612:
A.5 COMMENTER DATE RECEIVED 34. Mr.
- Page 1613 and 1614:
A.7 COMMENTER DATE RECEIVED 54. Edw
- Page 1615 and 1616:
A.9 COMMENTER DATE RECEIVED 79. Wal
- Page 1617 and 1618:
A.11 . COMMENTER- . .... . .... DAT
- Page 1619 and 1620:
A. 13 COMMENTER DATE RECEIVED 132.
- Page 1621 and 1622:
A.15 COMMENTER DATE RECEIVED 157. F
- Page 1623 and 1624:
A.17 COMMENTER DATE RECEIVED 183. R
- Page 1625 and 1626:
A.19 COMMENTER DATE RECEIVED 208. J
- Page 1627 and 1628:
A.21 COMMENTER DATE RECEIVED LETTER
- Page 1629 and 1630:
A.23 COMMENTER DATE RECEIVED LETTER
- Page 1631 and 1632:
A.25 COMMENTER DATE RECEIVED LETTER
- Page 1633 and 1634:
A.27 COMMENTER DATE RECEIVED LETTER
- Page 1635 and 1636:
A.29 COMMENTER DATE RECEIVED LETTER
- Page 1637 and 1638:
A.31 COMMENTER DATE RECEIVED LETTER
- Page 1639 and 1640:
A.33 COMMENTER DATE RECEIVED LETTER
- Page 1641 and 1642:
A.35 COMMENTER DATE RECEIVED LETTER
- Page 1643 and 1644:
North Carolina: A.37 COMMENTER DATE
- Page 1645 and 1646:
APPENDIX B INDEX FOR COMMENT LETTER
- Page 1647 and 1648:
B.2 Letter Topic Area Pages 1 Costs
- Page 1649 and 1650:
B.4 Letter Topic Area Pages 30 (Con
- Page 1651 and 1652:
B.6 Letter Topic Area Pages 57 Gene
- Page 1653 and 1654:
B.8 Letter Topic Area Pages 102 Gen
- Page 1655 and 1656:
B.10 Letter Topic Area Pages 133 Wa
- Page 1657 and 1658:
B.12 Letter Topic Area Pages 160 Ge
- Page 1659 and 1660:
B.14 Letter Topic Area Pages. 198 W
- Page 1661 and 1662:
8.16 Letter Topic Area Pages 215 Wa
- Page 1663 and 1664:
C.1 APPENDIX C STATE AND FEDERAL AG
- Page 1665 and 1666:
State Of Idaho /' .DIVISION OF BUDG
- Page 1667 and 1668:
STATE OF KANSAS TENNESSEE §beparim
- Page 1669 and 1670:
B. 1JM PORTER H.T. SUTTON OFFICE OF
- Page 1671 and 1672:
Dr. Colin A. Heath July 10, 1979 Pa
- Page 1673 and 1674:
OFFICE OF THE GOVERNOR WILLIAM P. C
- Page 1675 and 1676:
(Office of file (aobernor Geoar Pus
- Page 1677 and 1678:
as storage facilities begin to reac
- Page 1679 and 1680:
C. Frank Harsche, III Socftary Juli
- Page 1681 and 1682:
,U - ,UNITED STATES DEPARTMENT OF C
- Page 1683 and 1684:
-3- TO: PP/EC - R. Lehm FROM: OA/Dx
- Page 1685 and 1686:
for promulgation as Federal guides
- Page 1687 and 1688:
2 published since the Draft EIS was
- Page 1689 and 1690:
6 Spec c The hazard indices discuss
- Page 1691 and 1692:
10 22. (Page 3.1.6, sixth paragraph
- Page 1693 and 1694:
14 15 43. (Page 3.1.40, physical pr
- Page 1695 and 1696:
18 74. (Page 3.1.106, third paragra
- Page 1697 and 1698:
22 23 101. (Page 3.6.1) The first p
- Page 1699 and 1700:
26 27 124. (Page D.8) - The model u
- Page 1701 and 1702:
30 The consequence analysis as it b
- Page 1703 and 1704:
34 United States Department of the
- Page 1705 and 1706:
-4- -5- -4- An important criterion
- Page 1707 and 1708:
-8- -9- Modeling of Groundwater Mod
- Page 1709 and 1710:
-12- -13- Reasonable bounds for the
- Page 1711 and 1712:
3 Page 3.1.30. Third paragraph, fir
- Page 1713 and 1714:
7 8 also include at least generaliz
- Page 1715 and 1716:
11- 12 Page 3.1.6, par. 3, line 2:
- Page 1717 and 1718:
15 shaft and borehole sealing; larg
- Page 1719 and 1720:
1.9 20 Page 3.1.106. par. 3: What w
- Page 1721 and 1722:
UNITED STATES NUCLEAR REGULATORY CO
- Page 1723 and 1724:
INDEX TO GEIS COMMENTS 1. GENERAL..
- Page 1725 and 1726:
1-3 Comment Number Comment 1-4 .5 T
- Page 1727 and 1728:
1-7 Comment Comment Number Number ,
- Page 1729 and 1730:
2-1 2-2 Comment Comment Number Numb
- Page 1731 and 1732:
Comment Number 2-5 d. Transportatio
- Page 1733 and 1734:
2-9 2-10 Comment Comment Number Num
- Page 1735 and 1736:
C ~, "0 '0 , ' 0omment C Numb1 0 .3
- Page 1737 and 1738:
Comment Number 2-17 Comment Number
- Page 1739 and 1740:
3-1 3-2 Comment Number Comment Numb
- Page 1741 and 1742:
3-5 3-6 Comment Number Comment Numb
- Page 1743 and 1744:
Comment Number 3-9 Comment Number i
- Page 1745 and 1746:
3-13 Comment Comment Number Number
- Page 1747 and 1748:
Comment Number 3-17 3-18 Comment Nu
- Page 1749 and 1750:
3-21 3-22 Comment Comment Number Nu
- Page 1751 and 1752:
3-25 Comment Number Comment Number
- Page 1753 and 1754:
3-29 3-30 Comment .. Comment "'umbe
- Page 1755 and 1756:
3-33 Comment Comment Number ,lumber
- Page 1757 and 1758:
3-37 3-38 Comment Number Comment Nu
- Page 1759 and 1760:
3-41 3-42 Comment Comment Number Nu
- Page 1761 and 1762:
Comment Number 4-3 Comment Number I
- Page 1763 and 1764:
4-7 4-8 Comment Comment Number Numb
- Page 1765 and 1766:
Comnent ,iumoer 4-11 Comment Number
- Page 1767 and 1768:
5-2 Comment lNumber Comment 5-3 5-3
- Page 1769 and 1770:
Dr. Cblin A. Heath nivision of Wast
Inappropriate
Loading...
Inappropriate
You have already flagged this document.
Thank you, for helping us keep this platform clean.
The editors will have a look at it as soon as possible.
Mail this publication
Loading...
Embed
Loading...
Delete template?
Are you sure you want to delete your template?
DOWNLOAD ePAPER
This ePaper is currently not available for download.
You can find similar magazines on this topic below under ‘Recommendations’.
