- Page 1 and 2:
FINAL DOE/EIS-0046F Volume 1 of 3 U
- Page 3 and 4:
* Development of conventionally min
- Page 5 and 6:
vi Locations of DOE Regional Office
- Page 7 and 8:
viii CONTENTS (contd) 1.6.3 Acciden
- Page 9 and 10:
CONTENTS (contd) REFERENCES FOR SEC
- Page 11 and 12:
xii CONTENTS (contd) 4.4.3.1 Vault
- Page 13 and 14:
xiv CONTENTS (contd) 4.9.3 Detailed
- Page 15 and 16:
xvi CONTENTS (contd) 5.3.3 Effect o
- Page 17 and 18:
xviii CONTENTS (contd) 6.1.2 Rock M
- Page 19 and 20:
XX CONTENTS (contd) 6.2.1.2 Very De
- Page 21 and 22:
xxii CONTENTS (contd) 6.2.5.5 Islan
- Page 23 and 24:
xxiv FIGURES (contd) 4.3.10 Process
- Page 25 and 26:
xxvi VOLUME 1 TABLES 1.1.1 Total Sp
- Page 27 and 28:
xxviii TABLES (contd) 4.7.7 Dose to
- Page 29 and 30:
XXX TABLES (contd) 5.4.20 Selected
- Page 31 and 32:
xxxii TABLES (contd) 6.1.20 Estimat
- Page 33 and 34:
xxxiv TABLES (contd) 7.4.2 Comparis
- Page 35 and 36:
1.2 The DOE is proposing a program
- Page 37 and 38:
106 ---- - 104 104 : 10 Ce- S - \ -
- Page 39 and 40:
1.2 THE PROGRAMMATIC ALTERNATIVES 1
- Page 41 and 42:
ELEVATOR SHAFT FOR SPENT FUEL OR FU
- Page 43 and 44:
1.10 Once licensing approvals are o
- Page 45 and 46:
1.12 example, a large labor force b
- Page 47 and 48:
1.14 water transport to the biosphe
- Page 49 and 50:
1.16 .1.4 ALTERNATIVE ACTION--BALAN
- Page 51 and 52:
1.18 1.4.5 Ice Sheet Disposal Conce
- Page 53 and 54:
1.20 Space disposal is of interest
- Page 55 and 56:
1.6 PREDISPOSAL SYSTEMS(a) 1.22 Aft
- Page 57 and 58:
1.24 1.7 ENVIRONMENTAL IMPACTS OF P
- Page 59 and 60:
1.26 1.7.1 System Radiological Impa
- Page 61 and 62:
1.28 TABLE 1.7.5. Comparison of Hea
- Page 63 and 64:
1.30 alternative program. The range
- Page 65 and 66:
1.32 * Resource commitments also in
- Page 67 and 68:
REFERENCES FOR CHAPTER 1 1.34 Code
- Page 69 and 70:
PLUTONIUM-URANIUM FUELFABRICATION 2
- Page 71 and 72:
2.4 With regard to receipt and stor
- Page 73 and 74:
Plan, including a summary of the pu
- Page 75 and 76:
2.8 The main body of the text (Volu
- Page 77 and 78:
2.10 2.3 OTHER DECISIONS CONCERNING
- Page 79 and 80:
2.12 The second major decision proc
- Page 81 and 82:
2.14 Using a general conceptual des
- Page 83 and 84:
3.1 CHAPTER 3 DESCRIPTION OF PROGRA
- Page 85 and 86:
3.3 The Interagency Review Group (I
- Page 87 and 88:
3.5 3.1.2 Alternative Action--Paral
- Page 89 and 90:
3.2 BASES FOR THE ANALYSIS 3.7 A nu
- Page 91 and 92:
3.9 ENRICHED NUER WATER BASIN SPENT
- Page 93 and 94:
3.11 wastes also result. These are
- Page 95 and 96:
500 400 300 5 200 -_J 100 - 3.13 CA
- Page 97 and 98:
3.15 3.2.4 Ecological and Atmospher
- Page 99 and 100:
3.17 nue impacts can be provided in
- Page 101 and 102:
3.19 quencies, source terms can be
- Page 103 and 104:
3.21 ownership. The constant dollar
- Page 105 and 106:
3.23 quences to the public followin
- Page 107 and 108:
REFERENCES FOR SECTION 3.2 3.25 Cla
- Page 109 and 110:
3.3.1.1 Cosmic Radiation 3.27 Cosmi
- Page 111 and 112:
3.29 surfaces, and 25 mrem/yr to bo
- Page 113 and 114:
3.31 Part 20 of the Code of Federal
- Page 115 and 116:
3.33 finding and listed radionuclid
- Page 117 and 118:
REFERENCES FOR SECTION 3.3 3.35 Tit
- Page 119 and 120:
3.37 One such hazard index is based
- Page 121 and 122:
3.39 Since long-term repository con
- Page 123 and 124:
3.41 those data that can reasonably
- Page 125 and 126:
3.5 NONTECHNICAL ISSUES 3.43 Many o
- Page 127 and 128:
3.45 the repository. Some feel that
- Page 129 and 130:
3.47 cooperative agreement with the
- Page 131 and 132:
3.49 Inspection, the regular checki
- Page 133 and 134:
REFERENCES FOR SECTION 3.5 3.51 Cod
- Page 135 and 136:
SPENT AT REACTOR AWAY FROM FUEL STO
- Page 137 and 138:
4.4 4.1.2 Predisposal System for th
- Page 139 and 140:
4.6 TABLE 4.1.3. Example Predisposa
- Page 141 and 142:
ONCE-THROUGH CYCLE SPENT FUEL STORA
- Page 143 and 144:
4.10 TABLE 4.2.1. Classification of
- Page 145 and 146:
4.12 BWR fuel models that account f
- Page 147 and 148:
TABLE 4.2.3. Selected Radionuclide
- Page 149 and 150:
4.16 TABLE 4.2.5. Selected Radionuc
- Page 151 and 152:
4.18 ENCAPSULATION SPENT FUEL WATER
- Page 153 and 154:
4.20 Combustible wastes produced du
- Page 155 and 156:
4.22 methods described in Chapter 6
- Page 157 and 158:
4.24 1) vitrification by in-can mel
- Page 159 and 160:
4.26 Some partitioning options may
- Page 161 and 162:
4.28 wells. The 90 Sr leach rate de
- Page 163 and 164:
4.30 Another synthetic mineral conc
- Page 165 and 166:
4.32 Center has been set up to prov
- Page 167 and 168:
4.34 FUEL ASSEMBLY SHEAR RETRIEVE U
- Page 169 and 170:
4.36 may be contact-handled. The qu
- Page 171 and 172:
4.38 4.3.3.4 Immobilization of Wet
- Page 173 and 174:
HEPA FILTER 4.40 CHARCOAL FILTER -
- Page 175 and 176:
4.3.4.2 Gaseous Radionuclide Recove
- Page 177 and 178:
4.44 treatment options at an FRP an
- Page 179 and 180:
4.46 TABLE 4.3.2. Estimated Quantit
- Page 181 and 182:
4.48 Harries, B. R. et al. 1979. De
- Page 183 and 184:
4.50 U.S. Energy Research and Devel
- Page 185 and 186:
4.52 4.4.1.1 Water Basin Storage of
- Page 187 and 188:
4.54. The exhaust air is monitored
- Page 189 and 190:
4.56 but double-walled tanks have b
- Page 191 and 192:
4.58 The storage yard is monitored
- Page 193 and 194:
4.60 A similar approach was examine
- Page 195 and 196:
REFERENCES FOR SECTION 4.4 4.62 Atl
- Page 197 and 198:
4.64 These existing casks were desi
- Page 199 and 200:
4.5.3.1 Fuel Residue Transport 4.66
- Page 201 and 202:
REFERENCES FOR SECTION 4.5 4.68 Per
- Page 203 and 204:
4.70 flanges, and disconnecting ele
- Page 205 and 206:
TABLE 4.6.1. Volumes and Radionucli
- Page 207 and 208:
TABLE 4.6.3. Radionuclides Released
- Page 209 and 210:
4.76 4.7 ENVIRONMENTAL IMPACTS OF P
- Page 211 and 212:
4.78 4.7.1.2 Nonradiological Efflue
- Page 213 and 214:
4.80 The expected socioeconomic imp
- Page 215 and 216:
TABLE 4.7.5. Resource Commitments f
- Page 217 and 218:
4.84 (those to which nearly all wor
- Page 219 and 220:
4.86 TABLE 4.7.8. Example Reprocess
- Page 221 and 222:
4.88 TABLE 4.7.9. Selected Social S
- Page 223 and 224:
4.90 4.8 ACCIDENT IMPACTS FOR PREDI
- Page 225 and 226:
4.92 Severe accidents resulting fro
- Page 227 and 228:
4.94 with a colocated spent fuel pa
- Page 229 and 230:
4.96 such as blowers, pumps, etc. T
- Page 231 and 232:
4.98 occur once per year due to imp
- Page 233 and 234:
REFERENCES FOR SECTION 4.8 Code of
- Page 235 and 236:
TABLE 4.9.1. Unit Costs of Predispo
- Page 237 and 238:
TABLE 4.9.2. Unit Costs of Predispo
- Page 239 and 240:
4.106 TABLE 4.9.3. Predisposal Unit
- Page 241 and 242:
4.108 $109/kg HM, which is comparab
- Page 243 and 244:
4.110 TABLE 4.9.7 Subsystems(a) Was
- Page 245 and 246:
4.112 4.10 SAFEGUARDS INCLUDING PHY
- Page 247 and 248:
4.114 1976). It is assumed that one
- Page 249 and 250:
4.116 The physical protection requi
- Page 251 and 252:
REFERENCES FOR SECTION 4.10 4.118 C
- Page 253 and 254:
5.2 This section provides an overvi
- Page 255 and 256:
5.4 breakdown into component minera
- Page 257 and 258:
5.6 geologic setting may require ex
- Page 259 and 260:
5.8 releases so that substantial nu
- Page 261 and 262:
Hole Sleeve 5.10 The function of ho
- Page 263 and 264:
5.12 integral part of this plan is
- Page 265 and 266:
5.2 STATUS OF TECHNOLOGY AND R&D 5.
- Page 267 and 268:
5.16 Gravity analysis can detect sm
- Page 269 and 270:
5.18 (Witherspoon 1977). Pulse inje
- Page 271 and 272:
5.20 Potentially active faults can
- Page 273 and 274:
5.22 release rate of the nuclides.
- Page 275 and 276:
5.24 5.2.3.1 Excavation and Undergr
- Page 277 and 278:
REFERENCES FOR SECTION 5.2 5.26 Alg
- Page 279 and 280:
5.28 Office of Nuclear Waste Manage
- Page 281 and 282:
5.30 TABLE 5.3.1. Conceptual Reposi
- Page 283 and 284:
BLDG EXCLUSION ZONE AGRICULTURAL FE
- Page 285 and 286:
5.34 areas occupy 650 to 730 ha, wi
- Page 287 and 288:
5.36 emplacement. Beyond this initi
- Page 289 and 290:
5.38 In the case of reprocessing cy
- Page 291 and 292:
5.40 sealed in an appropriately siz
- Page 293 and 294:
5.3.2.5 Retrievability 5.42 These c
- Page 295 and 296:
5.44 erations permit, as opposed to
- Page 297 and 298:
5.46 5.4 ENVIRONMENTAL IMPACTS RELA
- Page 299 and 300:
and no significant impacts are expe
- Page 301 and 302:
5.50 3 TABLE 5.4.6. Particulate Con
- Page 303 and 304:
5.52 5.4.3 Radiological Effects The
- Page 305 and 306:
5.54 chlorosis of young trifoliate
- Page 307 and 308:
5.56 the environment. Discharge of
- Page 309 and 310:
5.58 of wastes, placement of waste
- Page 311 and 312:
5.60 TABLE 5.4.15 Total Quantities
- Page 313 and 314:
5.62 TABLE 5.4.16 Estimated Manpowe
- Page 315 and 316:
5.64 TABLE 5.4.18. Selected Expecte
- Page 317 and 318:
5.66 5.4.6.6 Environmental Effects
- Page 319 and 320:
5.68 The 70-yr worldwide population
- Page 321 and 322:
5.70 The spoils piles could have an
- Page 323 and 324:
5.72 5.5 LONG-TERM ENVIRONMENTAL CO
- Page 325 and 326:
5.74 Fuel Reprocessing Waste Spent
- Page 327 and 328:
5.76 TABLE 5.5.1. First-Year Whole-
- Page 329 and 330:
5.78 The population dose from a met
- Page 331 and 332:
5.80 be from 4 x 10 - 3 to 3 x 10 -
- Page 333 and 334:
5.82 Seventy-year whole-body dose c
- Page 335 and 336:
5.84 Dilution Dilution Element Fact
- Page 337 and 338:
5.86 this conversion, a regional po
- Page 339 and 340:
5.88 probability that the drill (0.
- Page 341 and 342:
5.90 a few years. For purposes of t
- Page 343 and 344:
5.92 dose commitments are less than
- Page 345 and 346:
5.6 COST OF GEOLOGIC DISPOSAL 5.94
- Page 347 and 348:
5.96 kilogram of disposal in a basa
- Page 349 and 350:
5.98 5.6.5 Comparison with Other Co
- Page 351 and 352:
REFERENCES FOR SECTION 5.6 5.100 Be
- Page 353 and 354:
REFERENCES FOR SECTION 5.7 5.102 Co
- Page 355 and 356:
5.104 5.9 SHORT-TERM USES OF THE EN
- Page 357 and 358:
6.1 Chapter 6 ALTERNATIVE CONCEPTS
- Page 359 and 360:
6.3 Concept Summary. The concept su
- Page 361 and 362:
mined geologic repository, are not
- Page 363 and 364:
Reactors Waste Sources LWR Fuel Cyc
- Page 365 and 366:
6.1.1.2 System and Facility Descrip
- Page 367 and 368:
6.11 bridge crane would remove the
- Page 369 and 370:
6.13 For oil field rotary drilling,
- Page 371 and 372:
6.15 diameter of approximately 48 c
- Page 373 and 374:
6.17 * An improved understanding of
- Page 375 and 376:
Health Impacts 6.19 Radiological Ef
- Page 377 and 378:
6.21 The occupational hazards durin
- Page 379 and 380:
Resource Consumption 6.23 The consu
- Page 381 and 382:
6.25 evaluated only on the basis of
- Page 383 and 384:
6.1.1.7 Safeguards 6.27 As noted, t
- Page 385 and 386:
I* LWR Reactors 6.29 Waste Sources
- Page 387 and 388:
Spent and 6.31 Recycle Facilities N
- Page 389 and 390:
6.33 Drilling/Mining System. The re
- Page 391 and 392:
6.35 cause of the limited time, the
- Page 393 and 394:
6.37 are identical with those used
- Page 395 and 396:
6.39 Fracturing During Cooling. Dur
- Page 397 and 398:
6.41 Implementation Time and Estima
- Page 399 and 400:
6.43 TABLE 6.1.8. Occupational Dose
- Page 401 and 402:
6.45 TABLE 6.1.9. Estimated Energy
- Page 403 and 404:
6.47 radioactivity transport, movem
- Page 405 and 406:
6.49 Various options to be consider
- Page 407 and 408:
Reactor 6.51 Recycle Facilities Spe
- Page 409 and 410:
6.53 Repository Facility. The layou
- Page 411 and 412:
6.55 * Development of criteria for
- Page 413 and 414:
6.57 species that recolonize an isl
- Page 415 and 416:
6.59 Radionuclides might be sorbed
- Page 417 and 418:
6.61 Quantitative estimates of thes
- Page 419 and 420:
6.1.4.2 System and Facility Descrip
- Page 421 and 422:
6.65 RH-TRU and other Recycle TRU w
- Page 423 and 424:
6.67 Canisters HLW 2,380 Cladding H
- Page 425 and 426:
6.69 Waste Form. The waste form and
- Page 427 and 428:
6.71 Transportation. Transportation
- Page 429 and 430:
6.73 TABLE 6.1.11. Radiological Imp
- Page 431 and 432:
Socioeconomic Impacts 6.75 Because
- Page 433 and 434:
6.77 wastes (Deese 1976). This trea
- Page 435 and 436:
6.79 In each case, only those costs
- Page 437 and 438:
6.81 total costs are estimated to b
- Page 439 and 440:
Waste Sources Reactors Fuel Cycles
- Page 441 and 442:
Reactor Spent 6.85 M i n ed Recycle
- Page 443 and 444:
6.87 It appears possible, as an alt
- Page 445 and 446:
6.89 deployment of the concept desi
- Page 447 and 448:
6.91 * The capability for correctiv
- Page 449 and 450:
6.93 Other possible land impacts co
- Page 451 and 452:
6.95 6.1.5.5 Potential Impacts over
- Page 453 and 454:
6.97 described for the mined geolog
- Page 455 and 456:
6.99 TABLE 6.1.18. Operating Costs
- Page 457 and 458:
6.101 Isolation from the biosphere
- Page 459 and 460:
6.103 S Fuel R e farication Note: L
- Page 461 and 462:
6.105 would permit different isolat
- Page 463 and 464:
6.107 Shale deposits in the United
- Page 465 and 466:
6.109 Waste Preparation Technology.
- Page 467 and 468:
6.111 to shallow ground water or to
- Page 469 and 470:
6.113 may be conveniently divided i
- Page 471 and 472:
6.115 repositories (Section 5.5) an
- Page 473 and 474:
6.117 The geologic formation in whi
- Page 475 and 476:
6.1.7.1 Concept Summary 6.119 6.1.7
- Page 477 and 478:
The cycle continues by: 6.121 Spent
- Page 479 and 480:
6.123 6.1.7.3 Status of Technical D
- Page 481 and 482:
Implementation Time 6.125 The long
- Page 483 and 484:
6.127 TABLE 6.1.21. Annual Routine
- Page 485 and 486:
6.129 TABLE 6.1.25. Transportation
- Page 487 and 488:
Socioeconomic Impacts 6.131 Socioec
- Page 489 and 490:
6.133 Results of a long-term risk c
- Page 491 and 492:
6.135 TABLE 6.1.28. Operating Costs
- Page 493 and 494:
6.137 REACTORS Domestic Civilian F
- Page 495 and 496:
HLW From Fuel Processing Facility 6
- Page 497 and 498:
° 6.141 OTV/ORBIT 0.85 AU INSERTIO
- Page 499 and 500:
6.143 Waste Form. The waste form wo
- Page 501 and 502:
Implementation Time 6.145 With the
- Page 503 and 504:
6.147 (Bechtel 1979a). (See Table 6
- Page 505 and 506:
6.149 Regarding on- or near-pad acc
- Page 507 and 508:
6.151 * Public Sector.Economy. Curr
- Page 509 and 510:
6.153 * "Treaty on Principles Gover
- Page 511 and 512:
6.155 charges to DOE as a Space Shu
- Page 513 and 514:
6.157 Bell, W. J. 1971. An Analysis
- Page 515 and 516:
6.159 Environmental Protection Agen
- Page 517 and 518:
6.161 Lynn, R. D. and Z. E. Arlin.
- Page 519 and 520:
6.163 Sandia Laboratories. 1980. Su
- Page 521 and 522:
6.165 6.2 COMPARISON OF ALTERNATIVE
- Page 523 and 524:
6.167 fuel assemblies would be appr
- Page 525 and 526:
6.169 A reprocessing fuel cycle wou
- Page 527 and 528:
6.2.1.9 Space 6.171 In the space di
- Page 529 and 530:
Radiological Effects 6.173 TABLE 6.
- Page 531 and 532:
Non-Radiological Environmental Effe
- Page 533 and 534:
6.177 6.2.2.7 Long-Term Maintenance
- Page 535 and 536:
6.179 deep hole, island mined repos
- Page 537 and 538:
6.181 6.2.3.4 The Concept Should be
- Page 539 and 540:
Timing 6.183 The timing of implemen
- Page 541 and 542:
TABLE 6.2.6. Performance of Propose
- Page 543 and 544:
6.187 As discussed in Section 6.2.1
- Page 545 and 546:
6.189 design might well be limited
- Page 547 and 548:
6.191 6.2.4.4 Conformance with Fede
- Page 549 and 550:
6.193 appears not to significantly
- Page 551 and 552:
TABLE 6.2.8. Estimated Resource Com
- Page 553 and 554:
6.197 space disposal in an intermed
- Page 555 and 556:
REFERENCES FOR SECTION 6.2 6.199 Co
- Page 557 and 558:
6.2 annual throughput or a common e
- Page 559 and 560:
6.4 are identified for well injecti
- Page 561 and 562:
6.1.1.1 Concept Summary 6.6 6.1.1 V
- Page 563 and 564:
6.8 Recycle Geologic Facilitie UF6
- Page 565 and 566:
6.10 The canister would have to pro
- Page 567 and 568:
6.12 storage facility (Bechtel 1979
- Page 569 and 570:
6.14 Sealing. Standard oil field pr
- Page 571 and 572:
6.16 thermomechanical behavior woul
- Page 573 and 574:
6.18 Remote determinations of water
- Page 575 and 576:
6.20 TABLE 6.1.2. VDH Concept - Occ
- Page 577 and 578:
6.22 available at this time. Parame
- Page 579 and 580:
Potential Events 6.24 TABLE 6.1.6.
- Page 581 and 582:
6.26 TABLE 6.1.7. Long-Term Radiolo
- Page 583 and 584:
6.1.2.1 Concept Summary 6.28 6.1.2
- Page 585 and 586:
Waste-Type Compatibility 6.30 It is
- Page 587 and 588:
6.32 Predisposal Treatment of the W
- Page 589 and 590:
6.34 be: (1) the pipe and valve man
- Page 591 and 592:
6.36 The heat effects in the periph
- Page 593 and 594:
6.38 the necessary leaktightness of
- Page 595 and 596:
6.40 Data Base Development. Develop
- Page 597 and 598:
6.42 Radiological Impacts. During p
- Page 599 and 600:
6.44 1979a). In addition, with colo
- Page 601 and 602:
6.46 would be stored as a liquid, i
- Page 603 and 604:
6.1.3.1 Concept Summary 6.48 6.1.3
- Page 605 and 606:
Reactors 6.50 -|LWR| Waste Sources
- Page 607 and 608:
6.52 Precipitation Surface Faciliti
- Page 609 and 610:
6.54 6.1.3.3 Status of Technical De
- Page 611 and 612:
6.56 Moreover, although transportat
- Page 613 and 614:
6.58 International and Domestic Leg
- Page 615 and 616:
Sea Water Dilution 6.60 Discharge I
- Page 617 and 618:
6.1.4.1 Concept Summary 6.62 6.1.4
- Page 619 and 620:
Reactors 6.64 Waste Sources IF L W
- Page 621 and 622:
6.66 The ocean's benthic boundary l
- Page 623 and 624:
6.68 The total seabed area required
- Page 625 and 626:
6.70 Ion Transport in the Sediment.
- Page 627 and 628:
6.72 The SDP program plan has been
- Page 629 and 630:
6.74 TABLE 6.1.12. Estimated Dose C
- Page 631 and 632:
6.76 TABLE 6.1.13. Estimated Energy
- Page 633 and 634:
6.78 food chains and ultimate consu
- Page 635 and 636:
6.80 processed and disposed of, and
- Page 637 and 638:
6.1.5.1 Concept Summary 6.82 6.1.5
- Page 639 and 640:
6.84 Because the options for the wa
- Page 641 and 642:
Reprocessing Plant 6.86 Shielded Ce
- Page 643 and 644:
6.88 ,An important factor in this c
- Page 645 and 646:
6.90 * Radioactivity of water at ic
- Page 647 and 648:
6.92 Occupational casualties from t
- Page 649 and 650:
6.94 glass, before transportation t
- Page 651 and 652:
6.96 Specific areas of concern, as
- Page 653 and 654:
6.98 TABLE 6.1.17. Capital Costs Fo
- Page 655 and 656:
6.1.6.1 Concept Summary 6.100 6.1.6
- Page 657 and 658:
6.102 cases, the injection liquid w
- Page 659 and 660:
6.104 heated to above 100 C) (EPA 1
- Page 661 and 662:
6.106 capabilities, primarily perfo
- Page 663 and 664:
6.108 volume of geologic data (stra
- Page 665 and 666:
6.110 With the basic technology for
- Page 667 and 668:
Summary 6.112 Major uncertainties,
- Page 669 and 670:
Natural System Impacts 6.114 Effect
- Page 671 and 672:
6.116 natural gas storage, freshwat
- Page 673 and 674:
6.118 for a facility to perform rem
- Page 675 and 676:
Reactors 6.120 -- ILWRl Waste Sourc
- Page 677 and 678:
Predisposal Treatment 6.122 In a fu
- Page 679 and 680:
6.124 * The use of commercial power
- Page 681 and 682:
6.126 6.1.7.4 Impacts of Constructi
- Page 683 and 684:
6.128 TABLE 6.1.23. Occupational Ra
- Page 685 and 686:
6.130 TABLE 6.1.26. Summary Effects
- Page 687 and 688:
6.132 waste treatment facility woul
- Page 689 and 690:
6.134 more than 100 times for fresh
- Page 691 and 692:
6.1.8.1 Concept Summary 6.136 6.1.8
- Page 693 and 694:
6.138 quirements, high costs, and p
- Page 695 and 696:
6.140 The shielded waste container
- Page 697 and 698:
6.142 Retrievability/Recovery. Unti
- Page 699 and 700:
6.144 Rescue Technology. Remote aut
- Page 701 and 702:
6.146 6.1.8.4 Impacts of Constructi
- Page 703 and 704:
6.148 TABLE 6.1.30 Short Term (Pree
- Page 705 and 706:
6.150 In general, normal operation
- Page 707 and 708:
6.152 Critical Resources. Estimated
- Page 709 and 710:
6.154 The potential hazard from the
- Page 711 and 712:
REFERENCES FOR SECTION 6.1 6.156 Aa
- Page 713 and 714:
6.158 Cohen, J. J. et al. 1972. "In
- Page 715 and 716:
6.160 Holilster, J. C. and R. J. We
- Page 717 and 718: 6.162 Pardue, W. M. 1977. Prelimina
- Page 719 and 720: 6.164 White, D. E. 1965. "Saline Wa
- Page 721 and 722: 6.166 TABLE 6.2.1. Disposition of P
- Page 723 and 724: 6.168 Spent fuel assemblies would b
- Page 725 and 726: 6.170 A waste processing facility w
- Page 727 and 728: S\ 6.172 the spectrum of waste prod
- Page 729 and 730: 6.174 unit of electrical power by n
- Page 731 and 732: 6.176 policies" suggesting that con
- Page 733 and 734: 6.178 6.2.3 Application of Performa
- Page 735 and 736: 6.180 factory performance of the is
- Page 737 and 738: 6.182 development of methods for pr
- Page 739 and 740: 6.184 standard of judgement as to p
- Page 741 and 742: 6.186 tion of facilities. The failu
- Page 743 and 744: 6.188 The mined repository and very
- Page 745 and 746: 6.190 relative to waste treatment a
- Page 747 and 748: TABLE 6.2.7. Estimated costs of Var
- Page 749 and 750: 6.194 hole concept following packag
- Page 751 and 752: Radiological Effects TABLE 6.2.9. S
- Page 753 and 754: 6.2.5.4 Space Disposal 6.198 The pr
- Page 755 and 756: 7.1 CHAPTER 7 SYSTEM IMPACTS OF PRO
- Page 757 and 758: 7.3 adoption of this strategy was t
- Page 759 and 760: 7.5 these low-growth conditions. Th
- Page 761 and 762: 7.7 By combining the ORIGEN to matc
- Page 763 and 764: 7.9 Four types of waste management
- Page 765 and 766: 7.3 SYSTEM LOGISTICS 7.11 To develo
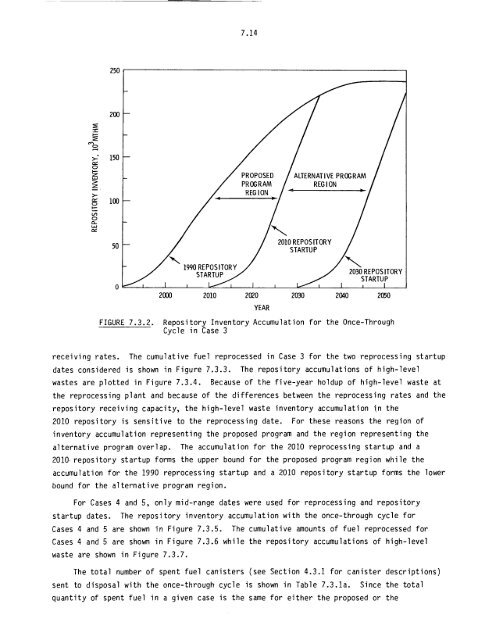
- Page 767: 7.13 7.3.1 Repository Inventory Acc
- Page 771 and 772: E 400 7.17 DCASE 5 S/ CASE 4 S300 z
- Page 773 and 774: 7.19 TABLE 7.3.2. Comparison of Awa
- Page 775 and 776: 7.21 wastes do become substantial f
- Page 777 and 778: TABLE 7.3.6. Comparison of Total Tr
- Page 779 and 780: 7.25 TABLE 7.3.8. Maximum (and mini
- Page 781 and 782: 7.27 The number of equivalent 30-ye
- Page 783 and 784: 7.29 TABLE 7.3.10. Number of 800-he
- Page 785 and 786: TABLE 7.3.12. Plutonium Disposition
- Page 787 and 788: TABLE 7.3.13. Total Radioactivity I
- Page 789 and 790: 7.35 reprocessing cycle wastes are
- Page 791 and 792: 7.37 TABLE 7.3.18 Principal Contrib
- Page 793 and 794: 7.39 TABLE 7.4.2 Comparison of 70-Y
- Page 795 and 796: 7.41 for discrimination in the sele
- Page 797 and 798: 7.43 TABLE 7.5.1 Resource Commitmen
- Page 799 and 800: TABLE 7.5.3 Comparison of Relative
- Page 801 and 802: 7.47 1980). (This schedule actually
- Page 803 and 804: 7.49 TABLE 7.6.4. Comparison of Lev
- Page 805 and 806: 7.51 TABLE 7.6.8. Comparison of Lev
- Page 807 and 808: 7.53 Unit costs for the present inv
- Page 809 and 810: 8.1 CHAPTER 8 GLOSSARY OF KEY TERMS
- Page 811 and 812: 8.3 Cask: A container that provides
- Page 813 and 814: FPF: Fuel packaging facility. 8.5 F
- Page 815 and 816: 8.7 Kaolinite: A common clay consis
- Page 817 and 818: 8.9 Primary Wastes: Untreated initi
- Page 819 and 820:
8.11 Transportation: Movement of ma
- Page 821 and 822:
iii VOLUME 2 CONTENTS APPENDIX A -
- Page 823 and 824:
V CONTENTS (contd) K.2 REMOVAL OF E
- Page 825 and 826:
vii FIGURES (contd) K.1.11 Very-Nea
- Page 827 and 828:
ix TABLES (contd) A.1.20 Spent Fuel
- Page 829 and 830:
xi TABLES (contd) A.3.9b Heat Gener
- Page 831 and 832:
xi11 TABLES (contd) A.9.3c Reposito
- Page 833 and 834:
xv TABLES (contd) P.2.4 Uranyl Phos
- Page 835 and 836:
TABLE A.1.1. Spent Fuel Logistics f
- Page 837 and 838:
TABLE A.1.3. Spent Fuel Logistics f
- Page 839 and 840:
TABLE A.1.5. Spent Fuel Logistics f
- Page 841 and 842:
TABLE A.1.7. Spent Fuel Logistics f
- Page 843 and 844:
TABLE A.1.9. Spent Fuel Logistics f
- Page 845 and 846:
A. 12 TABLE A.1.11. Spent Fuel Logi
- Page 847 and 848:
A.14 TABLE A.1.13. Spent Fuel Logis
- Page 849 and 850:
A.16 TABLE A.1.15. Spent Fuel Logis
- Page 851 and 852:
TABLE A.1.16. (Contd) REPOSITo0R SH
- Page 853 and 854:
TABLE A.1.17. (Contd) RFPPnrESS RSI
- Page 855 and 856:
TABLE A.1.18. (Contd) FPanCnr.EsS Y
- Page 857 and 858:
TABLE A.1.19. (Contd) cFPonrES StHI
- Page 859 and 860:
TABLE A.1.20. (Contd) RA*CTO9 YEAP
- Page 861 and 862:
TABLE A.1.22. Number of Containers
- Page 863 and 864:
A.2 RADIOACTIVE INVENTORY TABLES A.
- Page 865 and 866:
TABLE A.2.1b. Radioactivity Invento
- Page 867 and 868:
TABLE A.2.2b. Radioactivity Invento
- Page 869 and 870:
TABLE A.2.3b. Radioactivity Invento
- Page 871 and 872:
TABLE A.2.4b. Radioactivity Invento
- Page 873 and 874:
TABLE A.2.5b. Radioactivity Invento
- Page 875 and 876:
TABLE A.2.6b. Radioactivity Invento
- Page 877 and 878:
TABLE A.2.7b. Radioactivity Invento
- Page 879 and 880:
TABLE A.2.8b. Radioactivity Invento
- Page 881 and 882:
TABLE A.2.9b. Radioactivity Invento
- Page 883 and 884:
TABLE A.3.la. Heat Generation Rates
- Page 885 and 886:
TABLE A.3.2a. Heat Generation Rates
- Page 887 and 888:
TABLE A.3.3a. Heat Generation Rates
- Page 889 and 890:
TABLE A.3.4a. Heat Generation Rates
- Page 891 and 892:
TABLE A.3.5a. Heat'Generation Rates
- Page 893 and 894:
TABLE A.3.6a. Heat Generation Rates
- Page 895 and 896:
TABLE A.3.7a. Heat Generation Rates
- Page 897 and 898:
TABLE A.3.8a. Heat Generation Rates
- Page 899 and 900:
TABLE A.3.9a. Heat Generation Rates
- Page 901 and 902:
A.4' HAZARD INDEX TABLES A.68 The t
- Page 903 and 904:
A.70 TABLE A.4.1b. Hazard Index--On
- Page 905 and 906:
A. 72 TABLE A.4.2b. Hazard Index--O
- Page 907 and 908:
A.74 TABLE A.4.3b. Hazard Index--On
- Page 909 and 910:
A.76 TABLE A.4.4b. Hazard:Index--On
- Page 911 and 912:
A. 78 TABLE A.4.5b. Hazard Index--O
- Page 913 and 914:
A.80 TABLE A.4.6b. Hazard Index--Re
- Page 915 and 916:
A.82 TABLE A.4.7b. Hazard Index--Re
- Page 917 and 918:
A. 84 TABLE A.4.8b. Hazard Index--R
- Page 919 and 920:
A.86 TABLE A.4.9b. Hazard Index--Re
- Page 921 and 922:
A.88 TABLE A.5.la. Whole-Body Dose
- Page 923 and 924:
TABLE A.5.2a. Whole-Body Dose to th
- Page 925 and 926:
A.6 RESOURCE COMMITMENTS A.92 Resou
- Page 927 and 928:
TABLE A.6.2. Resource Commitments w
- Page 929 and 930:
A.7 TRANSPORTATION REQUIREMENTS A.9
- Page 931 and 932:
TABLE A.7.2. Transportation Require
- Page 933 and 934:
TABLE A.8.1. Cost Estimates for Tre
- Page 935 and 936:
A. 102 TABLE A.8.3. Cost Estimates
- Page 937 and 938:
A.9 SUPPLEMENTARY SYSTEM COST DATA
- Page 939 and 940:
TABLE A.9.1b. Allocation of Total-S
- Page 941 and 942:
TABLE A.9.2a. Allocation of Total-S
- Page 943 and 944:
TABLE A.9.2c. Allocation of Total-S
- Page 945 and 946:
TABLE A.9.3b. Repository Media Effe
- Page 947 and 948:
TABLE A.9.4a. Repository Media Effe
- Page 949 and 950:
TABLE A.9.4c. Repository Media Effe
- Page 951 and 952:
A.118 TABLE A.9.6. Estimated Resear
- Page 953 and 954:
TABLE A.10.1. Repository Requiremen
- Page 955 and 956:
B.1 APPENDIX B GEOLOGIC DISPOSAL SU
- Page 957 and 958:
B.3 Erosion by wind energy is a mec
- Page 959 and 960:
B.5 properties. The emplacement med
- Page 961 and 962:
B.7 Rocks are named and described a
- Page 963 and 964:
B.9 Through isotopic ratio dating,
- Page 965 and 966:
B.4 HYDROLOGIC CONSIDERATIONS B.11
- Page 967 and 968:
B.13 and the field measurement of h
- Page 969 and 970:
B.6 MULTIPLE GEOLOGIC BARRIERS B.15
- Page 971 and 972:
8.17 Salt deposit structures can be
- Page 973 and 974:
B.19 TABLE B.6.1. Average Chemical
- Page 975 and 976:
B.7 THE SITE SELECTION PROCESS B.21
- Page 977 and 978:
B.23 CANDIDATE REGIONS FROM STAGE I
- Page 979 and 980:
B.25 CONTINENTAL U.S. STAGE I DATA
- Page 981 and 982:
B.27 Office of Waste Isolation. 197
- Page 983 and 984:
C.2 the year of intake, and charge
- Page 985 and 986:
C.2 DERIVED LIMITS AND ACTION LEVEL
- Page 987 and 988:
C.6 boundary (e.g., evacuation). Th
- Page 989 and 990:
C.8 Taylor, L. S. 1973. The Origin
- Page 991 and 992:
D.2 employed here except that the p
- Page 993 and 994:
0.4 and 75 radionuclides. A summary
- Page 995 and 996:
D.6 farther than 2600 ft is negligi
- Page 997 and 998:
D.8 Baker's analysis indicated that
- Page 999 and 1000:
D.2.2.1 Dose Conversion Factors for
- Page 1001 and 1002:
D.12 The concentration during the n
- Page 1003 and 1004:
REFERENCES FOR APPENDIX D D.14 Atom
- Page 1005 and 1006:
E.1 APPENDIX E RADIOLOGICALLY RELAT
- Page 1007 and 1008:
warrants use in determining public
- Page 1009 and 1010:
E.5 The Reactor Safety Study(a) (RS
- Page 1011 and 1012:
E.2 GENETIC EFFECTS E.! It is known
- Page 1013 and 1014:
E.3 CONCLUSIONS E.9 For this Statem
- Page 1015 and 1016:
E.11 TABLE E.4.1. Comparison of Tra
- Page 1017 and 1018:
E.13 E.6 SPECIFIC CONSIDERATION OF
- Page 1019 and 1020:
E.15 In summary, it may be conclude
- Page 1021 and 1022:
REFERENCES FOR APPENDIX E E.17 Atom
- Page 1023 and 1024:
E.19 Shtukkenberg, Y. M. 1968. "Phy
- Page 1025 and 1026:
F.2 REGIONAL DEMOGRAPHY AND LAND US
- Page 1027 and 1028:
F.3 GEOLOGY F.4 The area in which t
- Page 1029 and 1030:
70 600 - 150 500 - F.6 40 =30 20 CL
- Page 1031 and 1032:
F.5 METEOROLOGY F.8 The general cli
- Page 1033 and 1034:
F.10 F.6 PATHWAY PARAMETERS RELEVAN
- Page 1035 and 1036:
G.1 APPENDIX G REFERENCE SITES FOR
- Page 1037 and 1038:
Population G.3 Table G.2.1 Selected
- Page 1039 and 1040:
H.1 APPENDIX H HAZARD INDICES The t
- Page 1041 and 1042:
H.3 number of MPI in the environmen
- Page 1043 and 1044:
H.5 Rochlin, G. I. 1977. "Nuclear W
- Page 1045 and 1046:
Defense HLW(b) TABLE I.1.1. Compari
- Page 1047 and 1048:
Defense TRU Waste On hand as of Sep
- Page 1049 and 1050:
K.1 THERMAL CRITERIA K.1 APPENDIX K
- Page 1051 and 1052:
subsequent precipitation of mineral
- Page 1053 and 1054:
K.5 Step 5: Make near-field rock me
- Page 1055 and 1056:
K.7 TABLE K.1.2. Thermal Load Limit
- Page 1057 and 1058:
K.9 TABLE K.1.4 Thermal Loadings Ac
- Page 1059 and 1060:
K.11 TEMPERATURE VS. DEPTH 400 -.-.
- Page 1061 and 1062:
K.13 TEMPERATURE VS. DEPTH 400 --.
- Page 1063 and 1064:
600 - K.15 TEMPERATURE VS. TIME 6.5
- Page 1065 and 1066:
K.17 TEMPERATURE VS. TIME 6.5 YR. O
- Page 1067 and 1068:
K.19 TABLE K.1.7. Thermal Loading L
- Page 1069 and 1070:
K.21 TABLE K.1.11. Maximum Near-Fie
- Page 1071 and 1072:
K.2 REMOVAL OF EMPLACED WASTE K.23
- Page 1073 and 1074:
K.25 K.2.2 Recoverable Emplacement
- Page 1075 and 1076:
K.27 TABLE K.3.1. Predominant Solut
- Page 1077 and 1078:
K.29 TABLE K.3.4 Retention Time Ran
- Page 1079 and 1080:
K.31 Neretnieks, I. 1977. Retardati
- Page 1081 and 1082:
USGS/LASL-SLA L.2 Evaluation of the
- Page 1083 and 1084:
L.2 HOST ROCK PROPERTIES L.4 Resear
- Page 1085 and 1086:
L.3 THERMAL AND RADIATION EFFECTS L
- Page 1087 and 1088:
Glossary of Acronyms Used in Append
- Page 1089 and 1090:
M.I APPENDIX M. BIBLIOGRAPHY FOR SE
- Page 1091 and 1092:
M.3 Bryant, E. A. et al. 1976. Oklo
- Page 1093 and 1094:
M.5 Department of Energy (DOE). 197
- Page 1095 and 1096:
M.7 Gorrell, T. C. 1979. Transmutat
- Page 1097 and 1098:
Loeding, J. W. 1961. The Fluid Bed
- Page 1099 and 1100:
M. 1 National Academy of Sciences (
- Page 1101 and 1102:
M.13 Roberts, J. J. et al. 1978. Pl
- Page 1103 and 1104:
M.15 Thompson, G. H. et al. 1979. A
- Page 1105 and 1106:
N.1 APPENDIX N WASTES FROM THORIUM-
- Page 1107 and 1108:
N.3 operation used to separate the
- Page 1109 and 1110:
P.1 APPENDIX P MINERALS THAT COULD
- Page 1111 and 1112:
P.3 One can usually establish only
- Page 1113 and 1114:
P.5 * pH. Most minerals are leached
- Page 1115 and 1116:
Element minerals P.7 TABLE P.1.4 Pl
- Page 1117 and 1118:
P.1.2.1 Leaching rate P.9 If the le
- Page 1119 and 1120:
P.11 Using Table P.1.6 as a guide,
- Page 1121 and 1122:
P.13 * firing the calcine, at tempe
- Page 1123 and 1124:
P.15 The reported rare earth conten
- Page 1125 and 1126:
P.17 Although the pure di-calcium s
- Page 1127 and 1128:
P.19 aluminosilicate framework stru
- Page 1129 and 1130:
P.21 The stability of this group of
- Page 1131 and 1132:
P.23 close association with albite,
- Page 1133 and 1134:
P.25 complex carbonates of the alka
- Page 1135 and 1136:
P.27 Ca(P04)3(0H) + 4H + - 5Ca 2+ +
- Page 1137 and 1138:
P.29 Xenotime contains a high amoun
- Page 1139 and 1140:
P.2.6.2 Uranate Minerals P.31 Urani
- Page 1141 and 1142:
P.33 depending on the number of wat
- Page 1143 and 1144:
P.3 MINERAL TABLES P.35 P.3.1 Hosts
- Page 1145 and 1146:
P.37 TABLE P.3.1. (continued) Occur
- Page 1147 and 1148:
P.39 TABLE P.3.1. (continued) Occur
- Page 1149 and 1150:
P.41 TABLE P.3.1. (continued) Occur
- Page 1151 and 1152:
P.43 The rankings, except for the t
- Page 1153 and 1154:
P.45 Koreskawa 1954) and differenti
- Page 1155 and 1156:
P.47 uranium or thorium. Reports of
- Page 1157 and 1158:
REFERENCES FOR APPENDIX P P.49 Alex
- Page 1159 and 1160:
P.51 Mitchell, R. S. 1972.. "Virgin
- Page 1161 and 1162:
FINAL DOE/EIS-0046F Volume 3 of 3 U
- Page 1163 and 1164:
SAFEGUARDS GROWTH SCENARIOS GEOLOGI
- Page 1165 and 1166:
2 POLICY TOPIC AREAS KEY ISSUES . R
- Page 1167 and 1168:
4 Volume 2 Section of Final Stateme
- Page 1169 and 1170:
Issues 6 WASTE PROGRAM Several comm
- Page 1171 and 1172:
8 WASTE PROGRAM * The multibarrier
- Page 1173 and 1174:
Response 10 WASTE PROGRAM The objec
- Page 1175 and 1176:
Issue 12 LICENSING AND THE DECISION
- Page 1177 and 1178:
14 LICENSING AND THE DECISION-MAKIN
- Page 1179 and 1180:
Response 16 SITING ISSUES While the
- Page 1181 and 1182:
Response 18 SITING ISSUES In keepin
- Page 1183 and 1184:
Issues 20 FUEL CYCLE ISSUES Several
- Page 1185 and 1186:
Issue 22 ATTRIBUTION OF COSTS/RISKS
- Page 1187 and 1188:
24 GENERAL COMMENTS In addition to
- Page 1189 and 1190:
Draft p. iv Issue 26 ORGANIZATION A
- Page 1191 and 1192:
Issue 28 ORGANIZATION AND PRESENTAT
- Page 1193 and 1194:
Section of Final Statement 30 ORGAN
- Page 1195 and 1196:
Response 32 ORGANIZATION AND PRESEN
- Page 1197 and 1198:
Draft pp. iv and 1.2 Issue 34 SCOPE
- Page 1199 and 1200:
Response 5.2). Issue 36 SCOPE Such
- Page 1201 and 1202:
(167) 38 SCOPE The problems or cost
- Page 1203 and 1204:
40 RADIOLOGICAL ISSUES presently re
- Page 1205 and 1206:
Draft p. 2.2.3 Issue 42 RADIOLOGICA
- Page 1207 and 1208:
Draft p. 2.3.3 Issue 44 RADIOLOGICA
- Page 1209 and 1210:
46 RADIOLOGICAL ISSUES particles (h
- Page 1211 and 1212:
48 RADIOLOGICAL ISSUES it has been
- Page 1213 and 1214:
Draft p. 3.1.144 Issue 50 RADIOLOGI
- Page 1215 and 1216:
Draft Appendix C Issue 52 RADIOLOGI
- Page 1217 and 1218:
Response 54 RADIOLOGICAL ISSUES EPA
- Page 1219 and 1220:
56 RADIOLOGICAL ISSUES The EPA risk
- Page 1221 and 1222:
58 RADIOLOGICAL ISSUES Transuranium
- Page 1223 and 1224:
60 RADIOLOGICAL ISSUES BEIR III (19
- Page 1225 and 1226:
62 CONSEQUENCE ANALYSIS Risk define
- Page 1227 and 1228:
64 CONSEQUENCE ANALYSIS Sr and Cs h
- Page 1229 and 1230:
66 CONSEQUENCE ANALYSIS individual
- Page 1231 and 1232:
Response 68 CONSEQUENCE ANALYSIS Th
- Page 1233 and 1234:
70 CONSEQUENCE ANALYSIS been provid
- Page 1235 and 1236:
72 CONSEQUENCE.ANALYSIS on a sound
- Page 1237 and 1238:
Response 74 CONSEQUENCE ANALYSIS DO
- Page 1239 and 1240:
Draft p. 3.1.100 Issue 76 CONSEQUEN
- Page 1241 and 1242:
Draft p. 3.1.123 Issue 78 CONSEQUEN
- Page 1243 and 1244:
80 CONSEQUENCE ANALYSIS demonstrate
- Page 1245 and 1246:
82 CONSEQUENCE ANALYSIS The followi
- Page 1247 and 1248:
Response 84 iCONSEQUENCE ANALYSIS T
- Page 1249 and 1250:
Draft pp. 3.1.148-155 Issue ,86 CON
- Page 1251 and 1252:
Draft p. 3.1.155 Issue 88 CONSEQUEN
- Page 1253 and 1254:
Draft pp. 3.1.165-168 Issue 90 CONS
- Page 1255 and 1256:
92 CONSEQUENCE ANALYSIS Note the as
- Page 1257 and 1258:
94 CONSEQUENCE ANALYSIS are found i
- Page 1259 and 1260:
96 CONSEQUENCE ANALYSIS Briefly, th
- Page 1261 and 1262:
98 CONSEQUENCE ANALYSIS rates to be
- Page 1263 and 1264:
Response 100 CONSEQUENCE ANALYSIS T
- Page 1265 and 1266:
102 CONSEQUENCE ANALYSIS in additio
- Page 1267 and 1268:
104 CONSEQUENCE ANALYSIS Three sour
- Page 1269 and 1270:
106 CONSEQUENCE ANALYSIS would depe
- Page 1271 and 1272:
Issue 108 CONSEQUENCE ANALYSIS A qu
- Page 1273 and 1274:
Response 110 CONSEQUENCE ANALYSIS A
- Page 1275 and 1276:
Response 112 CONSEQUENCE ANALYSIS T
- Page 1277 and 1278:
Issue 114 DOSE CALCULATIONS Several
- Page 1279 and 1280:
Draft p. 1.20 Issue 116 DOSE CALCUL
- Page 1281 and 1282:
Response 118 DOSE CALCULATIONS In p
- Page 1283 and 1284:
Response 120 DOSE CALCULATIONS Dilu
- Page 1285 and 1286:
Response 122 DOSE CALCULATIONS The
- Page 1287 and 1288:
Response 124 DOSE CALCULATIONS The
- Page 1289 and 1290:
Response 126 DOSE CALCULATIONS The
- Page 1291 and 1292:
Issue 128 RISK PERSPECTIVES Several
- Page 1293 and 1294:
Response 130 RISK PERSPECTIVES * Th
- Page 1295 and 1296:
132 RISK PERSPECTIVES Draft p. 1.16
- Page 1297 and 1298:
Draft p. 3.1.64 Issue 134 RISK PERS
- Page 1299 and 1300:
Draft Appendix H Issue 136 RISK PER
- Page 1301 and 1302:
Response 138 RISK PERSPECTIVES EPA
- Page 1303 and 1304:
Draft p. 3.1.55 Issue 140 WASTE MAN
- Page 1305 and 1306:
Response 142 WASTE MANAGEMENT OPERA
- Page 1307 and 1308:
Response 144 WASTE MANAGEMENT OPERA
- Page 1309 and 1310:
14,6 WASTE MANAGEMENT OPERATIONS To
- Page 1311 and 1312:
Response 148 -WASTE MANAGEMENT OPER
- Page 1313 and 1314:
Response 150 WASTE MANAGEMENT OPERA
- Page 1315 and 1316:
Draft p. 3.1.90 Issue 152 WASTE MAN
- Page 1317 and 1318:
Response 1.54 WASTE MANAGEMENT OPER
- Page 1319 and 1320:
156 WASTE MANAGEMENT OPERATIONS AFR
- Page 1321 and 1322:
Draft p. 3.1.85 Issue 158 WASTE MAN
- Page 1323 and 1324:
Response 160 WASTE MANAGEMENT OPERA
- Page 1325 and 1326:
Draft pp. 1.11 Issue 162 WASTE MANA
- Page 1327 and 1328:
164 WASTE MANAGEMENT OPERATIONS whi
- Page 1329 and 1330:
166 WASTE MANAGEMENT OPERATIONS and
- Page 1331 and 1332:
168 WASTE MANAGEMENT OPERATIONS are
- Page 1333 and 1334:
Draft p. 1.4 Issue 170 WASTE MANAGE
- Page 1335 and 1336:
Draft p. 1.10 Issue 172 WASTE MANAG
- Page 1337 and 1338:
Response 174 WASTE MANAGEMENT OPERA
- Page 1339 and 1340:
Response 176 WASTE MANAGEMENT OPERA
- Page 1341 and 1342:
178 WASTE MANAGEMENT OPERATIONS Dra
- Page 1343 and 1344:
180 WASTE MANAGEMENT OPERATIONS 3.
- Page 1345 and 1346:
Draft p. 3.1.116 Issue 182 WASTE MA
- Page 1347 and 1348:
184 WASTE MANAGEMENT OPERATIONS sta
- Page 1349 and 1350:
DOE/ET-0028, pp. 7.4.43 and 7.5.46
- Page 1351 and 1352:
Draft pp. v and 3.1.6 Issue 188 FUE
- Page 1353 and 1354:
Draft pp 1.10, 1.23, 3.1.133 Issue
- Page 1355 and 1356:
192 COSTS 3. The construction cost
- Page 1357 and 1358:
Draft pp 3.1.210-212 Issue 194 COST
- Page 1359 and 1360:
196 COSTS Title Basin Size Cost Est
- Page 1361 and 1362:
Issue 198 COSTS An issue which need
- Page 1363 and 1364:
200 SAFEGUARDS For the waste in the
- Page 1365 and 1366:
202 SAFEGUARDS planning for assista
- Page 1367 and 1368:
Draft pp. 1.10 and 2.1.2 Issue 204
- Page 1369 and 1370:
Draft, p. 1.3 Issue (208-NRC) Respo
- Page 1371 and 1372:
Draft pp. 1.12 and 3.1.32 Issue 208
- Page 1373 and 1374:
Response 210 GEOLOGIC CONSIDERATION
- Page 1375 and 1376:
Draft pp. 1.14 and 3.1.11 Issue 212
- Page 1377 and 1378:
214 GEOLOGIC CONSIDERATIONS in thes
- Page 1379 and 1380:
216 GEOLOGIC CONSIDERATIONS The rev
- Page 1381 and 1382:
Draft p. 3.1.4 Issue 218 GEOLOGIC C
- Page 1383 and 1384:
Draft p. 3.1.5 Issue 220 GEOLOGIC C
- Page 1385 and 1386:
Draft p. 3.1.6 Issue 222 GEOLOGIC C
- Page 1387 and 1388:
Draft p. 3.1.8 Issue (113-EPA) Resp
- Page 1389 and 1390:
226 GEOLOGIC CONSIDERATIONS composi
- Page 1391 and 1392:
Response 228 GEOLOGIC CONSIDERATION
- Page 1393 and 1394:
Response 230 GEOLOGIC CONSIDERATION
- Page 1395 and 1396:
232 GEOLOGIC CONSIDERATIONS 5. Figu
- Page 1397 and 1398:
Draft p. 3.1.20 Issue 234 GEOLOGIC
- Page 1399 and 1400:
Draft p. 3.1.23 Issue 236 GEOLOGIC
- Page 1401 and 1402:
Draft pp. 3.1.24, 33 and 235 Issue
- Page 1403 and 1404:
Response 240 GEOLOGIC CONSIDERATION
- Page 1405 and 1406:
242 GEOLOGIC CONSIDERATIONS selecti
- Page 1407 and 1408:
244 GEOLOGIC CONSIDERATIONS The Tek
- Page 1409 and 1410:
Response The text was changed. Draf
- Page 1411 and 1412:
Response 248 GEOLOGIC CONSIDERATION
- Page 1413 and 1414:
Response 250 GEOLOGIC CONSIDERATION
- Page 1415 and 1416:
252 GEOLOGIC CONSIDERATIONS made. T
- Page 1417 and 1418:
Draft p. 3.1.124 Issue 254 GEOLOGIC
- Page 1419 and 1420:
256 GEOLOGIC CONSIDERATIONS effects
- Page 1421 and 1422:
Response 258 GEOLOGIC CONSIDERATION
- Page 1423 and 1424:
260 GEOLOGIC CONSIDERATIONS be mapp
- Page 1425 and 1426:
262 GEOLOGIC CONSIDERATIONS tectoni
- Page 1427 and 1428:
264 GEOLOGIC CONSIDERATIONS Since e
- Page 1429 and 1430:
Issue 266 GEOLOGIC CONSIDERATIONS S
- Page 1431 and 1432:
Issue 268 GEOLOGIC CONSIDERATIONS I
- Page 1433 and 1434:
270 GEOLOGIC CONSIDERATIONS the Nev
- Page 1435 and 1436:
Draft p. 3.1.6 Issue 272 MULTIBARRI
- Page 1437 and 1438:
Draft p. 3.1.40 Issue 274 MULTIBARR
- Page 1439 and 1440:
Draft p. 3.1.55 Issue 276 MULTIBARR
- Page 1441 and 1442:
Draft p. 3.1.61 Issue 278 MULTIBARR
- Page 1443 and 1444:
Draft Appendix L Issue 280 MULT.IBA
- Page 1445 and 1446:
282 MULTIBARRIERS FOR DISPOSAL cont
- Page 1447 and 1448:
Draft p. 1.6 Issue 284 SOCIOECONOMI
- Page 1449 and 1450:
Draft p. 3.1.25 Issue 286 SOCIOECON
- Page 1451 and 1452:
Draft p. 3.1.75 Issue 288 SOCIOECON
- Page 1453 and 1454:
290 SOCIOECONOMIC/SOCIOPOLITICAL IS
- Page 1455 and 1456:
292 SOCIOECONOMIC/SOCIOPOLITICAL IS
- Page 1457 and 1458:
294 RESOURCE REQUIREMENTS a site sp
- Page 1459 and 1460:
Response REFERENCE ENVIRONMENTS DOE
- Page 1461 and 1462:
Response 298 REFERENCE ENVIRONMENTS
- Page 1463 and 1464:
Draft pp. 1.1, 31, 35, 36 Issue 300
- Page 1465 and 1466:
302 COMPARATIVE ASSESSMENT 2. To st
- Page 1467 and 1468:
304 COMPARATIVE ASSESSMENT Draft p.
- Page 1469 and 1470:
Response 306 COMPARATIVE ASSESSMENT
- Page 1471 and 1472:
Draft p. 4.9 Issue 308 COMPARATIVE
- Page 1473 and 1474:
Response 310 COMPARATIVE ASSESSMENT
- Page 1475 and 1476:
Response 312 COMPARATIVE ASSESSMENT
- Page 1477 and 1478:
314 ALTERNATIVE DISPOSAL CONCEPTS g
- Page 1479 and 1480:
316 ALTERNATIVE DISPOSAL CONCEPTS h
- Page 1481 and 1482:
Response 318 ALTERNATIVE DISPOSAL C
- Page 1483 and 1484:
Draft Appendix P Issue 320 ALTERNAT
- Page 1485 and 1486:
Draft p. 1.25 Issue 322 ALTERNATIVE
- Page 1487 and 1488:
Draft p. 3.3.7 Issue 324 ALTERNATIV
- Page 1489 and 1490:
Draft p. 3.3.30 Issue 326 ALTERNATI
- Page 1491 and 1492:
Draft p. 3.3.33 Issue 328 ALTERNATI
- Page 1493 and 1494:
Response 330. ALTERNATIVE DISPOSAL
- Page 1495 and 1496:
332 ALTERNATIVE DISPOSAL CONCEPTS A
- Page 1497 and 1498:
334 ALTERNATIVE DISPOSAL CONCEPTS D
- Page 1499 and 1500:
Draft p. 3.4.13 Issue Response 336
- Page 1501 and 1502:
Issue 338 ALTERNATIVE DISPOSAL CONC
- Page 1503 and 1504:
Draft Section 3.5 Issue 340 ALTERNA
- Page 1505 and 1506:
Response 342 ALTERNATIVE DISPOSAL C
- Page 1507 and 1508:
Draft p. 3.5.16 Issue 344 ALTERNATI
- Page 1509 and 1510:
346 ALTERNATIVE DISPOSAL CONCEPTS o
- Page 1511 and 1512:
348 ALTERNATIVE DISPOSAL CONCEPTS S
- Page 1513 and 1514:
Response 350 ALTERNATIVE DISPOSAL C
- Page 1515 and 1516:
Draft p. 1.27 Issue 352 ALTERNATIVE
- Page 1517 and 1518:
354 ALTERNATIVE DISPOSAL CONCEPTS W
- Page 1519 and 1520:
356 ALTERNATIVE DISPOSAL CONCEPTS e
- Page 1521 and 1522:
Response Jbb ALTERNATIVE DISPOSAL C
- Page 1523 and 1524:
Draft p. 3.6.4 Issue 360 ALTERNATIV
- Page 1525 and 1526:
Response 362 ALTERNATIVE DISPOSAL C
- Page 1527 and 1528:
Draft p. 3.6.6 Issue 364 ALTERNATIV
- Page 1529 and 1530:
Response 366 ALTERNATIVE DISPOSAL C
- Page 1531 and 1532:
368 ALTERNATIVE DISPOSAL CONCEPTS T
- Page 1533 and 1534:
Draft p. 3.6.18 Issue Response 37U
- Page 1535 and 1536:
Draft p. 3.6.21 Issue 372 ALTERNATI
- Page 1537 and 1538:
Draft p. 3.6.24 Issue 374 ALTERNATI
- Page 1539 and 1540:
Response 376 ALTERNATIVE DISPOSAL C
- Page 1541 and 1542:
Draft Section 3.7 Issue 378 ALTERNA
- Page 1543 and 1544:
Response 380 ALTERNATIVE DISPOSAL C
- Page 1545 and 1546:
Draft p. 3.7.9 Issue 382 ALTERNATIV
- Page 1547 and 1548:
Response 384 ALTERNATIVE DISPOSAL C
- Page 1549 and 1550:
386 ALTERNATIVE DISPOSAL CONCEPTS W
- Page 1551 and 1552:
Draft p. 3.8.2 Issue 388 ALTERNATIV
- Page 1553 and 1554:
Draft p. 3.8.10 Issue 390 ALTERNATI
- Page 1555 and 1556:
Response 392 ALTERNATIVE DISPOSAL C
- Page 1557 and 1558:
Response 394 ALTERNATIVE DISPOSAL C
- Page 1559 and 1560:
Response 396 ALTERNATIVE DISPOSAL C
- Page 1561 and 1562:
398 ALTERNATIVE DISPOSAL CONCEPTS T
- Page 1563 and 1564:
400 ALTERNATIVE DISPOSAL CONCEPTS E
- Page 1565 and 1566:
Draft p. 3.10.18 Issue 402 ALTERNAT
- Page 1567 and 1568:
Draft p. 3.10.27 Issue 404 ALTERNAT
- Page 1569 and 1570:
Response 406 ALTERNATIVE DISPOSAL C
- Page 1571 and 1572:
408 HEARING BOARD REPORT AND RESPON
- Page 1573 and 1574:
410 Safeguards of the Nuclear Regul
- Page 1575 and 1576:
HEARING BOARD REPORT ON THE DEPARTM
- Page 1577 and 1578:
Associated documents that came to t
- Page 1579 and 1580:
Further, this sole statement of pur
- Page 1581 and 1582:
Not even those in the scientific co
- Page 1583 and 1584:
A common misconception is that hole
- Page 1585 and 1586:
In sumnary, humanistic consideratio
- Page 1587 and 1588:
4. EDITORIAL AND TERMINOLOGICAL Res
- Page 1589 and 1590:
Several views of comparative risk n
- Page 1591 and 1592:
Resp-nse Various spent fuel storage
- Page 1593 and 1594:
Since current costs in developing a
- Page 1595 and 1596:
multiple barrier concept, they shou
- Page 1597 and 1598:
F. MISCELLMEOUS ITMS REQUIRING REVI
- Page 1599 and 1600:
III. CONCLUSIONS Subject to the abo
- Page 1601 and 1602:
, Draft Environmental Impact Staten
- Page 1603 and 1604:
440 Interagency Review Group. 1978.
- Page 1605 and 1606:
U.S. Nuclear Regulatory Commission.
- Page 1607 and 1608:
A.1 APPENDIX A LIST OF RESPONDENTS
- Page 1609 and 1610:
A.3 COMMENTER DATE RECEIVED 12. Ms.
- Page 1611 and 1612:
A.5 COMMENTER DATE RECEIVED 34. Mr.
- Page 1613 and 1614:
A.7 COMMENTER DATE RECEIVED 54. Edw
- Page 1615 and 1616:
A.9 COMMENTER DATE RECEIVED 79. Wal
- Page 1617 and 1618:
A.11 . COMMENTER- . .... . .... DAT
- Page 1619 and 1620:
A. 13 COMMENTER DATE RECEIVED 132.
- Page 1621 and 1622:
A.15 COMMENTER DATE RECEIVED 157. F
- Page 1623 and 1624:
A.17 COMMENTER DATE RECEIVED 183. R
- Page 1625 and 1626:
A.19 COMMENTER DATE RECEIVED 208. J
- Page 1627 and 1628:
A.21 COMMENTER DATE RECEIVED LETTER
- Page 1629 and 1630:
A.23 COMMENTER DATE RECEIVED LETTER
- Page 1631 and 1632:
A.25 COMMENTER DATE RECEIVED LETTER
- Page 1633 and 1634:
A.27 COMMENTER DATE RECEIVED LETTER
- Page 1635 and 1636:
A.29 COMMENTER DATE RECEIVED LETTER
- Page 1637 and 1638:
A.31 COMMENTER DATE RECEIVED LETTER
- Page 1639 and 1640:
A.33 COMMENTER DATE RECEIVED LETTER
- Page 1641 and 1642:
A.35 COMMENTER DATE RECEIVED LETTER
- Page 1643 and 1644:
North Carolina: A.37 COMMENTER DATE
- Page 1645 and 1646:
APPENDIX B INDEX FOR COMMENT LETTER
- Page 1647 and 1648:
B.2 Letter Topic Area Pages 1 Costs
- Page 1649 and 1650:
B.4 Letter Topic Area Pages 30 (Con
- Page 1651 and 1652:
B.6 Letter Topic Area Pages 57 Gene
- Page 1653 and 1654:
B.8 Letter Topic Area Pages 102 Gen
- Page 1655 and 1656:
B.10 Letter Topic Area Pages 133 Wa
- Page 1657 and 1658:
B.12 Letter Topic Area Pages 160 Ge
- Page 1659 and 1660:
B.14 Letter Topic Area Pages. 198 W
- Page 1661 and 1662:
8.16 Letter Topic Area Pages 215 Wa
- Page 1663 and 1664:
C.1 APPENDIX C STATE AND FEDERAL AG
- Page 1665 and 1666:
State Of Idaho /' .DIVISION OF BUDG
- Page 1667 and 1668:
STATE OF KANSAS TENNESSEE §beparim
- Page 1669 and 1670:
B. 1JM PORTER H.T. SUTTON OFFICE OF
- Page 1671 and 1672:
Dr. Colin A. Heath July 10, 1979 Pa
- Page 1673 and 1674:
OFFICE OF THE GOVERNOR WILLIAM P. C
- Page 1675 and 1676:
(Office of file (aobernor Geoar Pus
- Page 1677 and 1678:
as storage facilities begin to reac
- Page 1679 and 1680:
C. Frank Harsche, III Socftary Juli
- Page 1681 and 1682:
,U - ,UNITED STATES DEPARTMENT OF C
- Page 1683 and 1684:
-3- TO: PP/EC - R. Lehm FROM: OA/Dx
- Page 1685 and 1686:
for promulgation as Federal guides
- Page 1687 and 1688:
2 published since the Draft EIS was
- Page 1689 and 1690:
6 Spec c The hazard indices discuss
- Page 1691 and 1692:
10 22. (Page 3.1.6, sixth paragraph
- Page 1693 and 1694:
14 15 43. (Page 3.1.40, physical pr
- Page 1695 and 1696:
18 74. (Page 3.1.106, third paragra
- Page 1697 and 1698:
22 23 101. (Page 3.6.1) The first p
- Page 1699 and 1700:
26 27 124. (Page D.8) - The model u
- Page 1701 and 1702:
30 The consequence analysis as it b
- Page 1703 and 1704:
34 United States Department of the
- Page 1705 and 1706:
-4- -5- -4- An important criterion
- Page 1707 and 1708:
-8- -9- Modeling of Groundwater Mod
- Page 1709 and 1710:
-12- -13- Reasonable bounds for the
- Page 1711 and 1712:
3 Page 3.1.30. Third paragraph, fir
- Page 1713 and 1714:
7 8 also include at least generaliz
- Page 1715 and 1716:
11- 12 Page 3.1.6, par. 3, line 2:
- Page 1717 and 1718:
15 shaft and borehole sealing; larg
- Page 1719 and 1720:
1.9 20 Page 3.1.106. par. 3: What w
- Page 1721 and 1722:
UNITED STATES NUCLEAR REGULATORY CO
- Page 1723 and 1724:
INDEX TO GEIS COMMENTS 1. GENERAL..
- Page 1725 and 1726:
1-3 Comment Number Comment 1-4 .5 T
- Page 1727 and 1728:
1-7 Comment Comment Number Number ,
- Page 1729 and 1730:
2-1 2-2 Comment Comment Number Numb
- Page 1731 and 1732:
Comment Number 2-5 d. Transportatio
- Page 1733 and 1734:
2-9 2-10 Comment Comment Number Num
- Page 1735 and 1736:
C ~, "0 '0 , ' 0omment C Numb1 0 .3
- Page 1737 and 1738:
Comment Number 2-17 Comment Number
- Page 1739 and 1740:
3-1 3-2 Comment Number Comment Numb
- Page 1741 and 1742:
3-5 3-6 Comment Number Comment Numb
- Page 1743 and 1744:
Comment Number 3-9 Comment Number i
- Page 1745 and 1746:
3-13 Comment Comment Number Number
- Page 1747 and 1748:
Comment Number 3-17 3-18 Comment Nu
- Page 1749 and 1750:
3-21 3-22 Comment Comment Number Nu
- Page 1751 and 1752:
3-25 Comment Number Comment Number
- Page 1753 and 1754:
3-29 3-30 Comment .. Comment "'umbe
- Page 1755 and 1756:
3-33 Comment Comment Number ,lumber
- Page 1757 and 1758:
3-37 3-38 Comment Number Comment Nu
- Page 1759 and 1760:
3-41 3-42 Comment Comment Number Nu
- Page 1761 and 1762:
Comment Number 4-3 Comment Number I
- Page 1763 and 1764:
4-7 4-8 Comment Comment Number Numb
- Page 1765 and 1766:
Comnent ,iumoer 4-11 Comment Number
- Page 1767 and 1768:
5-2 Comment lNumber Comment 5-3 5-3
- Page 1769 and 1770:
Dr. Cblin A. Heath nivision of Wast