- Page 1 and 2:
Whitman ES District Capacity Distri
- Page 3 and 4:
Whitman ES District Capacity Distri
- Page 5 and 6:
Whitman ES District Capacity Distri
- Page 7 and 8:
Whitman ES District Capacity Distri
- Page 9 and 10:
Whitman ES District Capacity Distri
- Page 11 and 12:
Whitman ES District Capacity Distri
- Page 13 and 14:
Whitman ES District Capacity Distri
- Page 15 and 16:
Whitman ES District Capacity Distri
- Page 17 and 18:
Whitman ES District Capacity Distri
- Page 19 and 20:
Whitman ES District Capacity Distri
- Page 21 and 22:
Whitman ES District Capacity Distri
- Page 23 and 24:
Whitman ES District Capacity Distri
- Page 25 and 26:
Whitman ES District Capacity Distri
- Page 27 and 28:
Whitman ES District Capacity Distri
- Page 29 and 30:
Whitman ES District Capacity Distri
- Page 31 and 32:
Whitman ES District Capacity Distri
- Page 33 and 34:
Whitman ES District Capacity Distri
- Page 35 and 36:
Whitman ES District Capacity Distri
- Page 37 and 38:
Whitman ES District Capacity Distri
- Page 39 and 40:
Whitman ES District Capacity Distri
- Page 41 and 42:
Whitman ES District Capacity Distri
- Page 43 and 44:
Whitman ES District Capacity Distri
- Page 45 and 46:
Whitman ES District Capacity Distri
- Page 47 and 48:
Whitman ES District Capacity Distri
- Page 49 and 50:
Introduction Welcome to a review an
- Page 51 and 52:
Table 1 --- School's Median OPI Sco
- Page 53 and 54:
Table 1 --- School's Median OPI Sco
- Page 55 and 56:
Table 1: School's Median OPI Score
- Page 57 and 58:
Table 1 --- School's Median OPI Sco
- Page 59 and 60:
Table 3 --- Comparison Proficient t
- Page 61 and 62:
Grade 05 2008-2009 2010-2011 Studen
- Page 63 and 64:
Table 3: Comparison Proficient to B
- Page 65 and 66:
Table 4: School to TPS to State Med
- Page 67 and 68:
OCCT 5.0 Data Analysis Standard NEI
- Page 69 and 70:
OCCT 4.0 Geometry & Measurement Sta
- Page 71 and 72:
Table 5: Median Percent Correct (0-
- Page 73 and 74:
Table 6: Priority Academic Student
- Page 75 and 76:
OCCT 1.0 Patterns & Algebraic Reaso
- Page 77 and 78:
Table 6: Vertically Aligned Median
- Page 79 and 80:
Explanation of Tables and Their Use
- Page 81 and 82:
Table 1 --- School's Median OPI Sco
- Page 83 and 84:
Table 1 --- School's Median OPI Sco
- Page 85 and 86: Table 1: School's Median OPI Score
- Page 87 and 88: Table 2: Historical Trend Data by P
- Page 89 and 90: Grade 04 2008-2009 2009-2010 2010-2
- Page 91 and 92: Grade 06 2009-2010 Students Scoring
- Page 93 and 94: Table 4 --- School to TPS to State
- Page 95 and 96: Table 5: Priority Academic Student
- Page 97 and 98: Table 5: Priority Academic Student
- Page 99 and 100: Table 5: Median Percent Correct (0-
- Page 101 and 102: Table 6: Priority Academic Student
- Page 103 and 104: Table 6: Vertically Aligned Median
- Page 105 and 106: TULSA PUBLIC SCHOOLS COMMUNICATION
- Page 107 and 108: a. Publish external TPS dashboard t
- Page 109 and 110: Assessment Rates - District Level
- Page 111 and 112: Assessment Values - Student Level
- Page 113 and 114: Math Results - Student level
- Page 115 and 116: How Performance is Reviewed for Hir
- Page 117 and 118: The TLE evaluation process is compr
- Page 119 and 120: Human Capital Partners meet with ea
- Page 121 and 122: TLE Observation and Evaluation Rubr
- Page 123 and 124: 3 Domain: Classroom Management Dime
- Page 125 and 126: 7 Domain: Instructional Effectivene
- Page 127 and 128: 10 Domain: Instructional Effectiven
- Page 129 and 130: 13 Domain: Instructional Effectiven
- Page 131 and 132: 15 Domain: Instructional Effectiven
- Page 133 and 134: 17 Domain: Professional Growth and
- Page 135: 20 Domain: Leadership 1 Ineffective
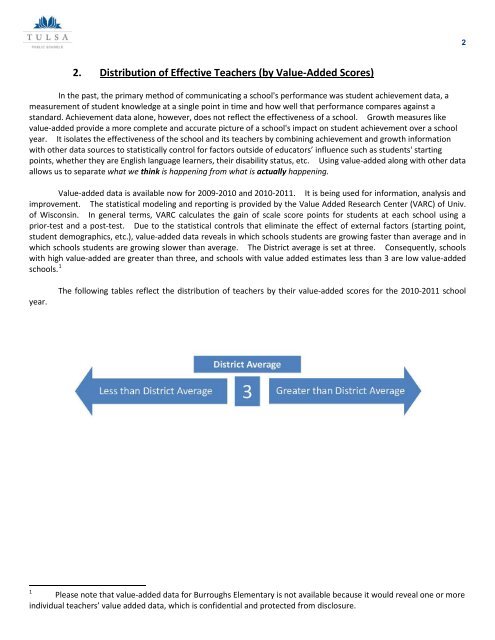
- Page 139 and 140: 4 Distribution of Teachers by Value
- Page 141 and 142: 6 Distribution of Teachers by Value
- Page 143 and 144: 8 Distribution of Teachers by Value
- Page 145 and 146: 10 Distribution of Teachers by Valu
- Page 147 and 148: 12 Priority Schools’ Distribution
- Page 149 and 150: 14 Priority Schools’ Distribution
- Page 151 and 152: • effective group facilitation sk
- Page 153 and 154: There are a number of ways in which
- Page 155 and 156: principal, other administrators, TP
- Page 157 and 158: More than 3000 students and their f
- Page 159 and 160: closed 14 schools due to under‐en
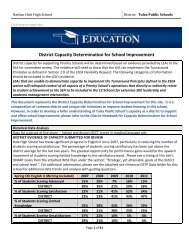
- Page 161 and 162: ESEA Waiver District Capacity Deter
- Page 163 and 164: 3 Priority Schools’ Value Added S
- Page 165 and 166: Introduction to Value-Added/Achieve
- Page 167 and 168: Elementary Schools (2010‐2011)
- Page 169 and 170: Bubble size represents size of the
- Page 171 and 172: Middle Schools (2010‐2011)
- Page 173 and 174: Bubble size represents size of the
- Page 175 and 176: Bubble size represents size of the
- Page 177 and 178: Bubble size represents size of the
- Page 179 and 180: Bubble size represents size of the
- Page 181 and 182: Bubble size represents size of the
- Page 183 and 184: Bubble size represents size of the
- Page 185 and 186: Key to Elementary Schools’ Value-
- Page 187 and 188:
Bubble size represents size of the
- Page 189 and 190:
Bubble size represents size of the
- Page 191 and 192:
High Schools (3 Year Average)
- Page 193 and 194:
Bubble size represents size of the
- Page 195 and 196:
Bubble size represents size of the
- Page 197 and 198:
Bubble size represents size of the
- Page 199 and 200:
Bubble size represents size of the
- Page 201 and 202:
2011 VA SCHOOL REPORT MACARTHUR ELE
- Page 203 and 204:
2011 VA SCHOOL REPORT MACARTHUR ELE
- Page 205 and 206:
READING 2011 VA SCHOOL REPORT MACAR
- Page 207 and 208:
READING 2011 VA SCHOOL REPORT MACAR
- Page 209 and 210:
MATH 2011 VA SCHOOL REPORT MACARTHU
- Page 211 and 212:
SCIENCE 2011 VA SCHOOL REPORT MACAR
- Page 213 and 214:
WRITING 2011 VA SCHOOL REPORT MACAR
- Page 215 and 216:
2011 VA SCHOOL REPORT MACARTHUR ELE
- Page 217 and 218:
2011 VA SCHOOL REPORT MACARTHUR ELE
- Page 219 and 220:
ELEMENTARY TEAM 1: o Central, Roger
- Page 221 and 222:
COHORT 1: o Central, Rogers and Hal
- Page 223 and 224:
Hello Teachers, We want to make you
- Page 225 and 226:
ESEA Waiver District Capacity Deter
- Page 227 and 228:
Higher Education Partnerships, incl
- Page 229 and 230:
• Special education: special educ
- Page 231 and 232:
• subject-area pairing of mentors
- Page 233 and 234:
The TPS Leadership Development prog
- Page 235 and 236:
• Participants demonstrated impro
- Page 237 and 238:
with market pay resulting in a comp
- Page 239 and 240:
• 11 Steps to CACR data (relevant
- Page 241 and 242:
TPS Student Progress Portal Screen
- Page 243 and 244:
TPS Student Progress Portal Screen
- Page 245 and 246:
ESEA Waiver District Capacity Deter
- Page 247 and 248:
In general, Principals and Vice Pri
- Page 249 and 250:
ESEA Waiver District Capacity Deter
- Page 251 and 252:
strategic plan from a high level do
- Page 253 and 254:
FROM THE BOARD OF EDUCATION TULSA B
- Page 255 and 256:
ABOUT THE DISTRICT Who We Are TULSA
- Page 257 and 258:
SUBSTANTIVE FRAMEWORK Vision Missio
- Page 259 and 260:
CORE GOALS 1 Student Achievement-Ea
- Page 261 and 262:
5 Safe and Secure Schools-Ensure th
- Page 263 and 264:
Responsibilities include: • Assur
- Page 265 and 266:
Strategic Plan Core Goal Update Tul
- Page 267 and 268:
Strategic Objectives Review - Janua
- Page 269 and 270:
Strategic Objectives Review - Janua
- Page 271 and 272:
© Tulsa Public Schools 2011 Strate
- Page 273 and 274:
Developing Measures of Success Stra
- Page 275 and 276:
Monitoring Progress • This is the
- Page 277 and 278:
Student Achievement % students scor
- Page 279 and 280:
Teacher and Leader Effectiveness 90
- Page 281 and 282:
Financial Sustainability % Instruct
- Page 283 and 284:
Safe and Secure Schools Truancy: Ye
- Page 285 and 286:
How will we measure success? TPS PE
- Page 287 and 288:
© Tulsa Public Schools 2011
- Page 289 and 290:
Core Goal: Student Achievement Each
- Page 291 and 292:
Core Goal: Student Achievement Prog
- Page 293 and 294:
Core Goal: Student Achievement Alge
- Page 295 and 296:
Teacher and Leader Effectiveness Me
- Page 297 and 298:
Core Goal: Teacher and Leader Effec
- Page 299 and 300:
Core Goal: Teacher and Leader Effec
- Page 301 and 302:
Core Goal: Teacher and Leader Effec
- Page 303 and 304:
Core Goal: Safe and Secure Schools
- Page 305 and 306:
Financial Sustainability Measures o
- Page 307 and 308:
Core Goal: Financial Sustainability
- Page 309 and 310:
Core Goal: Financial Sustainability
- Page 311 and 312:
Core Goal: Performance-Based Cultur
- Page 313 and 314:
Core Goal: Performance-Based Cultur
- Page 315 and 316:
Core Goal: Performance-Based Cultur
- Page 317 and 318:
2011-2012 Balanced Scorecard Financ
- Page 319 and 320:
2011-2012 Balanced Scorecard Human
- Page 321 and 322:
2011-2012 Balanced Scorecard Human
- Page 323 and 324:
2011-2012 Balanced Scorecard Depart
- Page 325 and 326:
2011-2012 Balanced Scorecard Depart
- Page 327 and 328:
2011-2012 Balanced Scorecard Depart
- Page 329 and 330:
2011-2012 Balanced Scorecard Depart
- Page 331 and 332:
2011-2012 Balanced Scorecard Depart
- Page 333 and 334:
2011-2012 Balanced Scorecard Depart
- Page 335 and 336:
2011-2012 Balanced Scorecard Depart
- Page 337 and 338:
2011-2012 Balanced Scorecard Depart
- Page 339 and 340:
2011-2012 Balanced Scorecard Depart
- Page 341 and 342:
2010-2011 Balanced Scorecard Depart
- Page 343 and 344:
Menu of Strategies for Turnaround S
- Page 345 and 346:
• Provide professional developmen
- Page 347 and 348:
• Identify culturally competent m
- Page 349 and 350:
Elementary Schools were added to th
- Page 351 and 352:
Flippen/Learning Keys: Following a
- Page 353 and 354:
• CURRICULUM DEVELOPMENT‐ Learn
- Page 355 and 356:
• Monthly publication to families
- Page 357 and 358:
TLE Objectives and Progress Report
- Page 359 and 360:
TLE Objectives and Progress Report
- Page 361 and 362:
TLE Objectives and Progress Report
- Page 363:
TLE Objectives and Progress Report
- Page 375 and 376:
Table of Contents PART I - DESCRIPT
- Page 377 and 378:
C. Transitions 1. To receive a new
- Page 379 and 380:
G. Coordination of Services Walt Wh
- Page 381 and 382:
I. NCLB Compliance Elements Complia
- Page 383 and 384:
PART II - Action Plans Pre-Kinderga
- Page 385 and 386:
Grade / Instructional Focus: Pre-Ki
- Page 387 and 388:
PART II - Action Plans Kindergarten
- Page 389 and 390:
Grade / Instructional Focus: Kinder
- Page 391 and 392:
Instructional Technology Integrated
- Page 393 and 394:
Parental Participation • Parentin
- Page 395 and 396:
Instructional Technology Integrated
- Page 397 and 398:
Instructional Technology Integrated
- Page 399 and 400:
Parental Participation • Parentin
- Page 401 and 402:
Grade / Instructional Focus: 2nd Gr
- Page 403 and 404:
PART II - Action Plans 3rd Grade Re
- Page 405 and 406:
Grade / Instructional Focus: 3rd Gr
- Page 407 and 408:
Grade / Instructional Focus: 3rd Gr
- Page 409 and 410:
Grade / Instructional Focus: 3rd Gr
- Page 411 and 412:
Grade / Instructional Focus: 3rd Gr
- Page 413 and 414:
Grade / Instructional Focus: 3rd Gr
- Page 415 and 416:
Parental Participation • Parentin
- Page 417 and 418:
instruct the students to have one c
- Page 419 and 420:
Instructional Technology Integrated
- Page 421 and 422:
Instructional Technology Integrated
- Page 423 and 424:
student to practice money problems
- Page 425 and 426:
PART II - Action Plans 5th Grade Re
- Page 427 and 428:
Grade / Instructional Focus: 5th Gr
- Page 429 and 430:
Grade / Instructional Focus: 5th Gr
- Page 431 and 432:
Grade / Instructional Focus: 5th Gr
- Page 433 and 434:
Grade / Instructional Focus: 5th Gr
- Page 435 and 436:
Grade / Instructional Focus: 5th Gr
- Page 437 and 438:
PART II - Action Plans Attendance a
- Page 439 and 440:
Grade / Focus: Attendance Groups: _
- Page 441 and 442:
• Administrative designee will cr
- Page 443 and 444:
2011 VA SCHOOL REPORT WHITMAN ELEME
- Page 445 and 446:
2011 VA SCHOOL REPORT WHITMAN ELEME
- Page 447 and 448:
2011 VA SCHOOL REPORT MATH WHITMAN
- Page 449 and 450:
2011 VA SCHOOL REPORT READING WHITM
- Page 451 and 452:
2011 VA SCHOOL REPORT MATH WHITMAN
- Page 453 and 454:
SOCIAL STUDIES 2011 VA SCHOOL REPOR
- Page 455 and 456:
2011 VA SCHOOL REPORT WHITMAN ELEME
- Page 457 and 458:
2011 VA SCHOOL REPORT WHITMAN ELEME
- Page 459 and 460:
Whitman Elementary School Comprehen
- Page 461 and 462:
Comments: Task Completed: 04/08/201
- Page 463 and 464:
Opportunity Score: 2 (3 - relativel
- Page 465 and 466:
Indicator EEIC-3.03 - All teachers
- Page 467 and 468:
Task Completed: 10/20/2011 Implemen
- Page 469 and 470:
Professional Learning Environment-E
- Page 471 and 472:
Assigned to: Elaine Buxton Target C
- Page 473 and 474:
Comments: Task Completed: 10/12/201
- Page 475 and 476:
Comments: Walt Whitman has conducte
- Page 477 and 478:
Indicator EEIIB-5.07 - School leade
- Page 479 and 480:
Assigned to: Sandra Johnson Target
- Page 481 and 482:
Indicator EEIIC-6.04 - School plann
- Page 483 and 484:
Indicator EEIIC-6.06 - School plann
- Page 485 and 486:
Describe current level of developme
- Page 487 and 488:
Opportunity Score: 2 (3 - relativel
- Page 489 and 490:
Collaborative Leadership-Effective
- Page 491 and 492:
Indicator EEIIIA-7.08 - School lead
- Page 493 and 494:
Implement 3. Administrator will see
- Page 495 and 496:
Target Completion Date: 11/05/2010
- Page 497 and 498:
Target Completion Date: 05/31/2011
- Page 499 and 500:
Collaborative Leadership-Effective
- Page 501 and 502:
Indicator EEIIIC-9.05 - School plan
- Page 503 and 504:
Indicator EEIIIC-9.06 - School lead
- Page 505 and 506:
Comments: Implement Percent Task Co
- Page 507 and 508:
Tulsa Public Schools Program Manage
- Page 509 and 510:
Tulsa Public Schools Program Manage
- Page 511:
Walt Whitman Moving from Good to Gr
- Page 515 and 516:
Dashboard Data Attendance % by Race
- Page 517 and 518:
Data for Gifted and Special ED
- Page 519 and 520:
Data Drives Instruction
- Page 521 and 522:
• Second Grade DIBELS Data
- Page 523 and 524:
• Third Data DIBELS Data
- Page 525 and 526:
SRI/SPI • Tested 4 th ‐6 th Gra
- Page 527 and 528:
Continuation…..SRI Data • Will
- Page 529 and 530:
Comparisons from the OCCT 2010 and
- Page 531 and 532:
Student Individualized Assessment P
- Page 533 and 534:
Plans for Additional Reading and Ma
- Page 535 and 536:
Additional Support Continued….
- Page 537 and 538:
Mentoring Programs • Boys Mentori
- Page 539 and 540:
PLCs Meeting regularly
- Page 541 and 542:
Whitman PLC’s
- Page 543 and 544:
TLE What works at Whitman • Initi
- Page 545 and 546:
TLE Continuation • If improvement
- Page 547:
A Continuous Journey……...