- Page 1 and 2:
Region L Multi-Jurisdictional Hazar
- Page 3 and 4:
Executive Summary The Regional Haza
- Page 5 and 6:
• Goal 4: Enhance communication a
- Page 7 and 8:
2.3.1 Geography/Topography 2.73 2.3
- Page 9 and 10:
1 Introduction/Planning Process 1.1
- Page 11 and 12:
would not be a requirement but high
- Page 13 and 14:
Mission X X X Mission Hills X X X M
- Page 15 and 16:
committee member versus being a par
- Page 17 and 18:
Following are some of the public co
- Page 19 and 20:
Figure 1.4. Opportunity to Read HMP
- Page 21 and 22:
covered. While I don’t doubt the
- Page 23 and 24:
the planning area for flood and ear
- Page 25 and 26:
2.2
- Page 27 and 28:
Table 2.2. Housing Unit Gains 2000-
- Page 29 and 30:
Table 2.3. Estimated Replacement Va
- Page 31 and 32:
2.2 Johnson County History The firs
- Page 33 and 34:
2.2.2 Johnson County Climate Johnso
- Page 35 and 36:
INDUSTRY Estimated Employees % Info
- Page 37 and 38:
Table 2.8. Johnson County Administr
- Page 39 and 40:
Table 2.10. Johnson County Program
- Page 41 and 42:
• Mahaffie House 1100 Kansas City
- Page 43 and 44:
City of Edgerton Overview Edgerton
- Page 45 and 46:
• Administration • Finance •
- Page 47 and 48:
Land Use and Development Trends In
- Page 49 and 50:
• Taxes for specific purposes •
- Page 51 and 52:
Personnel Resources Yes/No Departme
- Page 53 and 54:
Personnel Resources Yes/No Departme
- Page 55 and 56:
Administer, as well as eight city c
- Page 57 and 58:
• Capital Improvements Project Fu
- Page 59 and 60:
Existing Plans and Policies The Cit
- Page 61 and 62:
Property Valuation Table 2.22 below
- Page 63 and 64:
• Local Recovery Plan • County
- Page 65 and 66:
Team Hazardous Materials Expert Yes
- Page 67 and 68:
Technical and Fiscal Resources Tool
- Page 69 and 70:
Personnel Resources Yes/No Departme
- Page 71 and 72:
Table 2.19. City of Shawnee Personn
- Page 73 and 74:
a mayor/city council form of govern
- Page 75 and 76:
City of Westwood Westwood is situat
- Page 77 and 78:
• Withholding spending in hazard
- Page 79 and 80:
Fiscal resources that the district
- Page 81 and 82:
U.S.D. 230 Spring Hill USD 230 serv
- Page 83 and 84:
Existing Plans and Policies In part
- Page 85 and 86:
U.S.D. 233 Olathe USD 233 serves Ol
- Page 87 and 88:
School Olathe North High 600 E Prai
- Page 89 and 90:
Crestview Elementary School trailer
- Page 91 and 92:
Specialist serves as the Emergency
- Page 93 and 94:
Source: Johnson County AIMS (mitiga
- Page 95 and 96:
esponsible for rural areas, suburba
- Page 97 and 98:
2.3.1 Leavenworth County Geography/
- Page 99 and 100:
2.3.2 Leavenworth County Climate Th
- Page 101 and 102:
INDUSTRY Estimate % Arts, entertain
- Page 103 and 104:
Personnel Resources Filled(?) Depar
- Page 105 and 106:
Evacuation Route Map Yes Critical F
- Page 107 and 108:
• Leavenworth Downtown Historic D
- Page 109 and 110:
Table 2.41. Appraised Property Valu
- Page 111 and 112:
City of Tonganoxie The City of Tong
- Page 113 and 114:
miles, the population density of Ba
- Page 115 and 116:
Other Mitigation Activities None Pr
- Page 117 and 118:
Figure 2.7. Leavenworth County Unif
- Page 119 and 120:
USD 449 Easton USD 449 serves 117 s
- Page 121 and 122:
Other Mitigation Activities Fire dr
- Page 123 and 124:
• Full-time Building Official (Pr
- Page 125 and 126:
Asset Address Sq Feet Replacement V
- Page 127 and 128:
2.4 Wyandotte County Wyandotte Coun
- Page 129 and 130:
2.4.3 County Population/Demographic
- Page 131 and 132:
Sales & Office 23% 22% 27% 28% Mana
- Page 133 and 134:
Personnel Resources Yes/No Departme
- Page 135 and 136:
2.4.7 Other Assets Other vulnerable
- Page 137 and 138:
Engineer/Professional trained in co
- Page 139 and 140:
• Fees for Water, Sewer, Gas, or
- Page 141 and 142:
2.4.9 Unified School Districts Wyan
- Page 143 and 144:
U.S.D. 204 Bonner-Edwardsville Bonn
- Page 145 and 146:
Located at 6565 State Avenue: The D
- Page 147 and 148:
2.4.13 Drainage and Water Districts
- Page 149 and 150:
2.4.14 Private Non-Profits The foll
- Page 151 and 152:
are addressed in greater detail. Th
- Page 153 and 154:
Characteristic Ranking Definition 2
- Page 155 and 156:
Declaration Number Declaration Date
- Page 157 and 158:
Declaration Number Declaration Date
- Page 159 and 160:
3.2 Hazard Profiles Requirement §2
- Page 161 and 162:
Based on FEMA minimum disaster requ
- Page 163 and 164:
Crop Pests/Diseases Many factors in
- Page 165 and 166:
Figure 3.1 Map of Cooperative Emera
- Page 167 and 168:
severe in northeast Kansas and in t
- Page 169 and 170:
• Johnson County saw a 7% decreas
- Page 171 and 172:
Table 3.13. EMAP Consequence Analys
- Page 173 and 174: Types of Mobs A mob can be defined
- Page 175 and 176: Impact and Vulnerability Potential
- Page 177 and 178: The CPRIs for each county of Region
- Page 179 and 180: 3.2.4 Dam and Levee Failure Calcula
- Page 181 and 182: Location Table 3.19 provides the nu
- Page 183 and 184: Figure 3.3. Dams in Johnson County,
- Page 185 and 186: Figure 3.5. Dams in Wyandotte Count
- Page 187 and 188: people and property from larger, le
- Page 189 and 190: ehind the levee will be mapped as m
- Page 191 and 192: Table 3.21. Region L DFIRM With Lev
- Page 193 and 194: Figure 3.8. Levee’s in Wyandotte
- Page 195 and 196: MT Planning Region County Incident
- Page 197 and 198: Levee Failure Although both federal
- Page 199 and 200: Table 3.28 Top 10 Counties by Dam F
- Page 201 and 202: owners are responsible for maintain
- Page 203 and 204: Minimal to severe depending on area
- Page 205 and 206: the reservoirs—some of which are
- Page 207 and 208: In Region L, the primary source of
- Page 209 and 210: networks, motor carrier authorities
- Page 211 and 212: Extent The severity of a drought in
- Page 213 and 214: Table 3.35 Phased Drought Response
- Page 215 and 216: Table 3.37. Ranges for Drought Vuln
- Page 217 and 218: Single Well Source—The supplier r
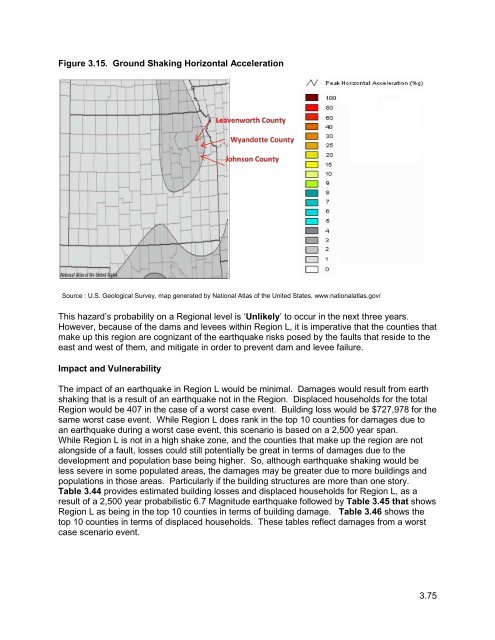
- Page 219 and 220: 3.3.5 Earthquake Calculated Priorit
- Page 221 and 222: Location X. Some well-built wooden
- Page 223: • April 9, 1952: A damaging earth
- Page 227 and 228: • An area of concern for the regi
- Page 229 and 230: 3.2.7 Expansive Soils Calculated Pr
- Page 231 and 232: Figure: 3.17. General Soil Content:
- Page 233 and 234: Impact and Vulnerability While Regi
- Page 235 and 236: Table 3.55. Consequence Analysis: E
- Page 237 and 238: Figure 3.18. Heat Index (HI) Chart
- Page 239 and 240: Location All of Region L is suscept
- Page 241 and 242: freezing for the entire period. Dai
- Page 243 and 244: Region L has experienced an average
- Page 245 and 246: Johnson County Table 3.58. Johnson
- Page 247 and 248: 3.2.9 Flood Calculated Priority Ris
- Page 249 and 250: Figure 3.22. Marais des Cygnes Basi
- Page 251 and 252: Table 3.62. Disaster Declarations f
- Page 253 and 254: Merriam 06/03/2008 Flood 0 0 0.00K
- Page 255 and 256: EASTON 10/18/2007 Flood 0 0 0.00K 0
- Page 257 and 258: Table 3.68. NCDC Flash Flood Events
- Page 259 and 260: • June 2010: A frontal boundary c
- Page 261 and 262: Table 3.70. Summary of Reported Flo
- Page 263 and 264: Table 3.73. HAZUS MH 2.1 Flood Scen
- Page 265 and 266: Wyandotte County Bonner Springs, Ci
- Page 267 and 268: Merriam 16 9 7 Mission Hills 8 0 8
- Page 269 and 270: Mitigation of Repetitive Loss Prope
- Page 271 and 272: northwest edge of Kansas City, Kans
- Page 273 and 274: Figure 3.26. Planning Region L Hazu
- Page 275 and 276:
Figure 3.28. Leavenworth County DFI
- Page 277 and 278:
Johnson County Figure 3.30. DeSoto
- Page 279 and 280:
Figure 3.32. Cities of Mission, Mis
- Page 281 and 282:
Figure 3.34. City of Olathe 3.132
- Page 283 and 284:
Figure 3.36. City of Prairie Villag
- Page 285 and 286:
Figure 3.38. City of Westwood and W
- Page 287 and 288:
Figure 3.40. USD231 3.138
- Page 289 and 290:
Figure 3.42. Johnson County Communi
- Page 291 and 292:
Figure 3.44. University of Kansas M
- Page 293 and 294:
Figure 3.46. City of Easton 3.144
- Page 295 and 296:
Figure 3.48. City of Leavenworth 3.
- Page 297 and 298:
Figure 3.50. USD207 & USD453 3.148
- Page 299 and 300:
Figure 3.52. USD458 3.150
- Page 301 and 302:
Figure 3.54. USD469 3.152
- Page 303 and 304:
Figure 3.56. USD464 3.154
- Page 305 and 306:
Wyandotte County Figure 3.58. City
- Page 307 and 308:
Figure 3.60. USD203 3.158
- Page 309 and 310:
Figure 3.62. USD500 3.160
- Page 311 and 312:
Figure 3.64. Kansas State School fo
- Page 313 and 314:
Consequence (Impact) Analysis The i
- Page 315 and 316:
Location Hail can happen anywhere w
- Page 317 and 318:
valuation, population density, crop
- Page 319 and 320:
Table 3.89. Ranges for Hail Vulnera
- Page 321 and 322:
communities. Counties in the planni
- Page 323 and 324:
3.2.11. Hazardous Materials Calcula
- Page 325 and 326:
area. Generally, it is the develope
- Page 327 and 328:
Figure 3.66 Region L’s Gas Transm
- Page 329 and 330:
Previous Occurrences When viewed st
- Page 331 and 332:
Table 3.101. Details of Kansas Pipe
- Page 333 and 334:
Table 3.103 Potential Cost Estimate
- Page 335 and 336:
• An area of concern for the Regi
- Page 337 and 338:
3.2.12 Land Subsidence Calculated P
- Page 339 and 340:
Another area of concern is karst; a
- Page 341 and 342:
• Coal Emergency Program Projects
- Page 343 and 344:
With the known number of acres in e
- Page 345 and 346:
Summary Land subsidence is a concer
- Page 347 and 348:
3.2.13 Landslide Calculated Priorit
- Page 349 and 350:
Landslides in the hilly terrain alo
- Page 351 and 352:
Figure 3.72. 1995 Johnson County La
- Page 353 and 354:
Table 3.121. EMAP Consequence Analy
- Page 355 and 356:
Location The Northeastern part of K
- Page 357 and 358:
Severe thunderstorms and the associ
- Page 359 and 360:
Table 3.128 below lists the top ten
- Page 361 and 362:
Table 3.132. EMAP Consequence Analy
- Page 363 and 364:
Mumps Mumps is a contagious disease
- Page 365 and 366:
presents as acute-onset vomiting, w
- Page 367 and 368:
Table 3.134. Reportable disease by
- Page 369 and 370:
The majority of these deaths, hospi
- Page 371 and 372:
Leavenworth County Major Disease Ou
- Page 373 and 374:
3.2.16 Radiological Calculated Prio
- Page 375 and 376:
Table 3.139. Radiological Incidence
- Page 377 and 378:
Johnson County Table 3.140. Johnson
- Page 379 and 380:
3.2.17 Soil Erosion and Dust Calcul
- Page 381 and 382:
Impact and Vulnerability There have
- Page 383 and 384:
Subject Ranking Impacts/Soil Erosio
- Page 385 and 386:
Previous Occurrences No previous te
- Page 387 and 388:
Cost of Decontamination @ $12/perso
- Page 389 and 390:
The vulnerability of the planning a
- Page 391 and 392:
Leavenworth County Table 3.150. Lea
- Page 393 and 394:
Figure 3.75. Tornado Activity in th
- Page 395 and 396:
• May 2012 - two tornadoes report
- Page 397 and 398:
Table 3.155. Crop Insurance Paid fo
- Page 399 and 400:
Table 3.157. Vulnerability of Regio
- Page 401 and 402:
Table 3.160. Vulnerability of Kansa
- Page 403 and 404:
Folks living in mobile homes die be
- Page 405 and 406:
3.2.20 Utility/Infrastructure Failu
- Page 407 and 408:
Figure 3.78. Map of Leavenworth Cou
- Page 409 and 410:
Transportation Routes Transportatio
- Page 411 and 412:
Table 3.167. FEMA Standard Values f
- Page 413 and 414:
Table 3.170. Wyandotte County CPRI:
- Page 415 and 416:
Previous Occurrences Extent • 8 A
- Page 417 and 418:
Figure 3.80. Issues that Create Wil
- Page 419 and 420:
Table 3.168. Mean Wildfire Risk Sco
- Page 421 and 422:
ains this soil is easily washed awa
- Page 423 and 424:
3.2.22 Windstorm Calculated Priorit
- Page 425 and 426:
Figure 3.82. Incidence of Derecho
- Page 427 and 428:
Table 3.176. Vulnerability of Kansa
- Page 429 and 430:
Table 3.179. Vulnerability of Kansa
- Page 431 and 432:
Table 3.184. EMAP Consequence Analy
- Page 433 and 434:
Heavy accumulations of ice, often t
- Page 435 and 436:
conditions, and impassable roads. T
- Page 437 and 438:
occur as a result of winter storms
- Page 439 and 440:
Table 3.187. Ranges for Winter Stor
- Page 441 and 442:
Total 1,477,000 Source: State Hazar
- Page 443 and 444:
3.24 References General Crop Insura
- Page 445 and 446:
Drought Colorado Owes Kansas for Wa
- Page 447 and 448:
Hail Hail Basics. National Oceanic
- Page 449 and 450:
Tornado 2012 Kansas Severe Weather
- Page 451 and 452:
4 Mitigation Strategy 44 CFR Requir
- Page 453 and 454:
impacts associated with each hazard
- Page 455 and 456:
Up to 100% for severe repetitive lo
- Page 457 and 458:
esponsibilities under the Water Ass
- Page 459 and 460:
Kansas Department of Transportation
- Page 461 and 462:
Fire Prevention Program - This prog
- Page 463 and 464:
Projections by county and public wa
- Page 465 and 466:
also maintain flows for navigation
- Page 467 and 468:
Johnson County Action ID Co. 1 Co.
- Page 469 and 470:
Prioritize locations where flood da
- Page 471 and 472:
MultiJ 4 MultiJ 5 MultiJ 6 Increase
- Page 473 and 474:
Edgerton 6 Edgerton 7 Edgerton Mari
- Page 475 and 476:
LQuivira 2 of the community but was
- Page 477 and 478:
Action ID Action/Description Priori
- Page 479 and 480:
Olathe 2 Olathe 3 Olathe 4 Olathe 5
- Page 481 and 482:
Olathe 10 Olathe 11 houses a free s
- Page 483 and 484:
OVP 2 OVP 3 reservoir capable of 48
- Page 485 and 486:
OVP 7 OVP 8 OVP 9 windows. Evaluati
- Page 487 and 488:
OVP 11 OVP 12 Acquisition of struct
- Page 489 and 490:
Roeland Pk 3 be compliant with the
- Page 491 and 492:
Shawnee 4 Shawnee 7 SH5 Shawnee 6 a
- Page 493 and 494:
SpringH 3 SpringH 4 Public informat
- Page 495 and 496:
publication #361, “Design and Con
- Page 497 and 498:
USD233 2 Back up generators for foo
- Page 499 and 500:
KSD 3 KSD 4 neighborhood groups liv
- Page 501 and 502:
Construction Guidance for Community
- Page 503 and 504:
FD2 2 doors and large surface area
- Page 505 and 506:
insurance policies protect property
- Page 507 and 508:
Warning Sirens Plan for the county,
- Page 509 and 510:
jurisdiction’s water resources an
- Page 511 and 512:
the county’s emergency response s
- Page 513 and 514:
within the county and assess the ne
- Page 515 and 516:
failure may cause extensive loss of
- Page 517 and 518:
appropriate building codes for the
- Page 519 and 520:
epair, as well as the GPS mapping o
- Page 521 and 522:
funding to complete hydrogeological
- Page 523 and 524:
amounts of property damage occur du
- Page 525 and 526:
the watershed districts goals and o
- Page 527 and 528:
flooding events. Action ID Action/D
- Page 529 and 530:
professional services and construct
- Page 531 and 532:
the Missouri River. The building wa
- Page 533 and 534:
such as the watershed districts goa
- Page 535 and 536:
esources are adequate for public sa
- Page 537 and 538:
Action ID Action/Description Priori
- Page 539 and 540:
plans, and USD emergency plans can
- Page 541 and 542:
WyCo 1 WYCo 2 WyCo 3 Develop altern
- Page 543 and 544:
WyCo 6 WyCo 7 WyCo 8 to take,• Wo
- Page 545 and 546:
WyCo 12 WyCo 13 WyCo 14 order to co
- Page 547 and 548:
WyCo 17 WyCo 18 MARC’s “Project
- Page 549 and 550:
WyCo 22 WyCo 23 Wyandotte County Em
- Page 551 and 552:
WyCo 27 WyCo 28 WyCo 29 up and prev
- Page 553 and 554:
WyCo 33 WyCo 34 cases, failed utili
- Page 555 and 556:
WyCo 38 WyCo 39 WyCo 40 lightning p
- Page 557 and 558:
WyCo 44 WyCo 45 WyCo 46 WyCo 47 tal
- Page 559 and 560:
WyCo 51 WyCo 52 WyCo 53 throughout
- Page 561 and 562:
WyCo 56 WyCo 57 WyCo 58 WyCo 59 haz
- Page 563 and 564:
WyCo 63 WyCo 64 implement in the ev
- Page 565 and 566:
WyCo 67 WyCo 68 WyCo 69 WyCo 70 suc
- Page 567 and 568:
WyCo 76 WyCo 77 WyCo 78 WyCo 79 WyC
- Page 569 and 570:
WyCo 84 themselves. The health, saf
- Page 571 and 572:
WyCo 89 to ensure all corrective ac
- Page 573 and 574:
MultiJ 2 MultiJ 3 need to have the
- Page 575 and 576:
BSprings 2 BSprings 3 BSprings 4 fl
- Page 577 and 578:
BSprings 8 BSprings 9 BSprings 10 r
- Page 579 and 580:
BSprings 14 address the undersized
- Page 581 and 582:
Wyandotte County - City of Lake Qui
- Page 583 and 584:
safe-rooms to provide adequate shel
- Page 585 and 586:
Wyandotte County - Kansas State Sch
- Page 587 and 588:
KSSB 5 All Hazard Staff & Student E
- Page 589 and 590:
RainbowM 2 for the facility. Procur
- Page 591 and 592:
KUMC 4 Create Saferoom at school an
- Page 593 and 594:
KVDD 3 KVDD 4 them from erosive for
- Page 595 and 596:
BSA 2 LakeForest 1 LakeForest 2 gui
- Page 597 and 598:
5 Plan Maintenance Process Requirem
- Page 599 and 600:
Appendix A: Signed Resolutions Mode
- Page 669 and 670:
Appendix D: References and Contacts
- Page 671 and 672:
• • • • • • • • •
- Page 673 and 674:
• National Climatic Data Center.