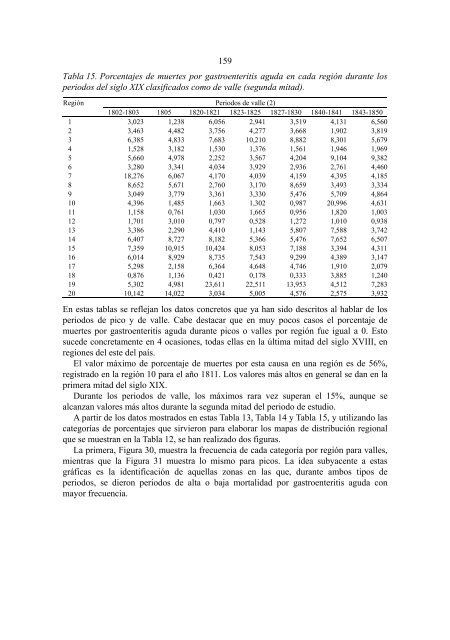
158 Tab<strong>la</strong> 13. Porcentajes <strong>de</strong> muertes por <strong>gastroenteritis</strong> <strong>aguda</strong> en cada región durante los periodos c<strong>la</strong>sificados como <strong>de</strong> pico. Región Periodos <strong>de</strong> pico 1779 1781 1789-1792 1808-1809 1811 1813 1831-1834 1 3,633 11,765 3,523 11,265 9,530 4,845 8,683 2 7,792 2,932 4,209 9,314 8,018 13,203 3,212 3 11,236 31,385 5,051 9,324 20,443 19,366 11,967 4 1,399 3,955 1,451 12,047 37,069 9,241 4,664 5 28,280 7,838 8,815 19,539 13,786 8,961 5,655 6 11,388 8,113 6,307 27,346 32,493 43,145 9,089 7 12,448 33,570 8,299 22,111 47,073 15,868 10,771 8 16,695 35,689 23,223 24,062 11,026 5,064 7,877 9 2,459 5,995 20,294 14,008 17,904 3,881 7,822 10 0,000 7,463 29,086 8,101 56,554 0,833 3,838 11 3,665 2,028 7,311 10,576 8,147 1,165 12,372 12 1,944 7,407 26,384 4,657 46,117 1,496 2,855 13 0,873 4,931 18,054 13,143 33,289 12,812 10,124 14 6,361 2,827 9,776 37,973 14,540 38,289 40,634 15 13,686 10,924 8,447 23,873 27,946 37,399 24,741 16 15,429 8,487 20,913 14,669 10,176 21,780 9,400 17 24,455 5,276 7,860 15,181 17,559 14,455 25,364 18 16,204 0,873 4,770 13,479 43,029 1,235 38,008 19 6,897 5,376 6,459 6,206 16,409 16,452 21,713 20 8,647 26,433 10,229 11,175 16,615 16,225 4,507 Tab<strong>la</strong> 14. Porcentajes <strong>de</strong> muertes por <strong>gastroenteritis</strong> <strong>aguda</strong> en cada región durante los periodos <strong>de</strong>l siglo XVIII, c<strong>la</strong>sificados como <strong>de</strong> valle (primera mitad). Región Periodos <strong>de</strong> valle (1) 1749-1753 1755-1762 1764-1772 1774 1782 1784-1787 1797 1799-1800 1 1,126 2,522 1,968 4,792 1,066 3,566 1,510 1,417 2 4,093 1,982 1,231 1,248 0,779 2,221 2,431 2,345 3 4,581 3,613 2,167 1,215 2,381 5,946 2,747 2,617 4 0,318 2,718 2,830 4,878 5,189 3,119 1,660 0,408 5 10,717 5,161 6,008 4,870 5,779 5,813 5,828 3,690 6 2,691 1,931 1,739 3,543 2,623 2,077 4,286 3,769 7 5,856 2,730 4,015 1,875 7,642 8,491 9,139 4,601 8 2,627 3,108 5,649 7,854 10,246 10,528 8,399 7,454 9 0,000 0,362 1,776 6,767 1,893 6,082 6,414 5,195 10 2,890 3,104 0,929 4,167 5,000 11,463 4,930 0,415 11 7,727 5,882 4,389 2,103 1,957 1,144 2,591 2,191 12 14,030 4,615 4,338 2,066 0,601 2,881 2,932 3,652 13 2,386 2,859 4,146 3,030 1,790 3,582 5,867 6,911 14 1,983 3,348 3,428 6,079 9,809 3,862 8,987 5,229 15 5,237 8,978 11,278 8,923 8,353 7,979 5,994 5,110 16 5,530 8,837 9,439 15,161 13,452 8,096 6,981 9,577 17 2,128 2,297 2,146 1,478 1,031 2,472 1,688 2,644 18 2,373 1,194 1,607 0,526 0,000 1,429 0,000 1,027 19 0,109 0,569 3,731 7,463 2,046 1,017 0,935 2,074 20 3,643 3,281 3,666 3,521 7,308 8,634 10,033 6,921
159 Tab<strong>la</strong> 15. Porcentajes <strong>de</strong> muertes por <strong>gastroenteritis</strong> <strong>aguda</strong> en cada región durante los periodos <strong>de</strong>l siglo XIX c<strong>la</strong>sificados como <strong>de</strong> valle (segunda mitad). Región Periodos <strong>de</strong> valle (2) 1802-1803 1805 1820-1821 1823-1825 1827-1830 1840-1841 1843-1850 1 3,023 1,238 6,056 2,941 3,519 4,131 6,560 2 3,463 4,482 3,756 4,277 3,668 1,902 3,819 3 6,385 4,833 7,683 10,210 8,882 8,301 5,679 4 1,528 3,182 1,530 1,376 1,561 1,946 1,969 5 5,660 4,978 2,252 3,567 4,204 9,104 9,382 6 3,280 3,341 4,034 3,929 2,936 2,761 4,460 7 18,276 6,067 4,170 4,039 4,159 4,395 4,185 8 8,652 5,671 2,760 3,170 8,659 3,493 3,334 9 3,049 3,779 3,361 3,330 5,476 5,709 4,864 10 4,396 1,485 1,663 1,302 0,987 20,996 4,631 11 1,158 0,761 1,030 1,665 0,956 1,820 1,003 12 1,701 3,010 0,797 0,528 1,272 1,010 0,938 13 3,386 2,290 4,410 1,143 5,807 7,588 3,742 14 6,407 8,727 8,182 5,366 5,476 7,652 6,507 15 7,359 10,915 10,424 8,053 7,188 3,394 4,311 16 6,014 8,929 8,735 7,543 9,299 4,389 3,147 17 5,298 2,158 6,364 4,648 4,746 1,910 2,079 18 0,876 1,136 0,421 0,178 0,333 3,885 1,240 19 5,302 4,981 23,611 22,511 13,953 4,512 7,283 20 10,142 14,022 3,034 5,005 4,576 2,575 3,932 En estas tab<strong>la</strong>s se reflejan los datos concretos que ya han sido <strong>de</strong>scritos al hab<strong>la</strong>r <strong>de</strong> los periodos <strong>de</strong> pico y <strong>de</strong> valle. Cabe <strong>de</strong>stacar que en muy pocos casos el porcentaje <strong>de</strong> muertes por <strong>gastroenteritis</strong> <strong>aguda</strong> durante picos o valles por región fue igual a 0. Esto suce<strong>de</strong> concretamente en 4 ocasiones, todas el<strong>la</strong>s en <strong>la</strong> última mitad <strong>de</strong>l siglo XVIII, en regiones <strong>de</strong>l este <strong>de</strong>l país. El valor máximo <strong>de</strong> porcentaje <strong>de</strong> muertes por esta causa en una región es <strong>de</strong> 56%, registrado en <strong>la</strong> región 10 para el año 1811. Los valores más altos en general se dan en <strong>la</strong> primera mitad <strong>de</strong>l siglo XIX. Durante los periodos <strong>de</strong> valle, los máximos rara vez superan el 15%, aunque se alcanzan valores más altos durante <strong>la</strong> segunda mitad <strong>de</strong>l periodo <strong>de</strong> estudio. A partir <strong>de</strong> los datos mostrados en estas Tab<strong>la</strong> 13, Tab<strong>la</strong> 14 y Tab<strong>la</strong> 15, y utilizando <strong>la</strong>s categorías <strong>de</strong> porcentajes que sirvieron para e<strong>la</strong>borar los mapas <strong>de</strong> distribución regional que se muestran en <strong>la</strong> Tab<strong>la</strong> 12, se han realizado dos figuras. La primera, Figura 30, muestra <strong>la</strong> frecuencia <strong>de</strong> cada categoría por región para valles, mientras que <strong>la</strong> Figura 31 muestra lo mismo para picos. La i<strong>de</strong>a subyacente a estas gráficas es <strong>la</strong> i<strong>de</strong>ntificación <strong>de</strong> aquel<strong>la</strong>s zonas en <strong>la</strong>s que, durante ambos tipos <strong>de</strong> periodos, se dieron periodos <strong>de</strong> alta o baja mortalidad por <strong>gastroenteritis</strong> <strong>aguda</strong> con mayor frecuencia.
- Page 1:
IMPORTANCIA DE LA VIRUELA, GASTROEN
- Page 4 and 5:
Copyright © 2005 University of Oul
- Page 7:
Xaviera, Torres Joerges, Importanci
- Page 11:
A mis padres y a mi hermano
- Page 14 and 15:
mucho, y si no que se lo pregunten
- Page 16 and 17:
Tabla 10. Distribución de las muer
- Page 18 and 19:
Tabla 46. Causas de muerte consider
- Page 21 and 22:
Índice de figuras Figura 1. Altitu
- Page 23 and 24:
Figura 24. Distribución de las mue
- Page 25 and 26:
Figura 48. Patrón estacional de la
- Page 27 and 28:
Figura 72. Porcentaje de muertes de
- Page 29 and 30:
Figura 94. Edad media de muerte por
- Page 31 and 32:
Figura 120. Distribución mensual d
- Page 33 and 34:
Figura 139. Mapa de Finlandia con l
- Page 35:
Figura 169. Número mensual de muer
- Page 38 and 39:
3 Material y métodos..............
- Page 40 and 41:
5.3.2 Aproximación temporal ......
- Page 43 and 44:
Prefacio Los trabajos que, como és
- Page 45:
43 y desarrollado en sus posteriore
- Page 48 and 49:
46 1.1 Medio físico 1.1.1 Marco ge
- Page 50 and 51:
48 Figura 2. Porcentaje de superfic
- Page 52 and 53:
50 En términos de geografía polí
- Page 54 and 55:
52 este clima la temperatura media
- Page 56 and 57:
54 siendo sustituida, en gran magni
- Page 58 and 59:
56 región sur, aprovechando lo exc
- Page 60 and 61:
58 Figura 9 en la que se representa
- Page 62:
60 1.2.2 Estructura de la població
- Page 65 and 66:
63 densidad de población podía es
- Page 67 and 68:
65 1.3 Marco histórico 1.3.1 Histo
- Page 69 and 70:
67 desconfiaban de la capacidad de
- Page 71 and 72:
69 También en 1812, los territorio
- Page 73 and 74:
71 ya se utilizaban desde el siglo
- Page 75 and 76:
73 En cuanto a la salud pública pu
- Page 77 and 78:
2 Objetivos El principal objetivo d
- Page 79 and 80:
3 Material y métodos 3.1 Material
- Page 81 and 82:
79 Toda esta labor recaía sobre lo
- Page 83 and 84:
81 − No todas las parroquias pert
- Page 85 and 86:
100% 90% 80% 70% 60% 50% 40% 30% 20
- Page 87 and 88:
85 Parroquia Años con datos Años
- Page 89 and 90:
87 Parroquia Años con datos Años
- Page 91 and 92:
89 Parroquia Años con datos Años
- Page 93 and 94:
91 menciona la edad al momento de l
- Page 95 and 96:
93 El número total de registros qu
- Page 97 and 98:
95 fiables (Pitkänen 1977). Alguno
- Page 99 and 100:
97 Tabla 4. Registros de bautismo u
- Page 101 and 102:
99 Para agrupar los datos procedent
- Page 103 and 104:
101 serán, una vez establecidos, u
- Page 105 and 106:
103 El segundo índice pretende med
- Page 107 and 108:
4 Gastroenteritis 4.1 Principales c
- Page 109 and 110: 107 Bacterias del género Shigella.
- Page 111 and 112: 109 La salmonela tífica sobrevive
- Page 113 and 114: 111 Existen otros patógenos bacter
- Page 115 and 116: 113 sin ocasionar daños pero bajo
- Page 117 and 118: 115 4.1.2.2 Vías de transmisión L
- Page 119 and 120: 117 aumento de la incidencia enferm
- Page 121 and 122: 119 1971), lo que coincide con la e
- Page 123 and 124: 121 Tabla 6. Causas de muerte relac
- Page 125 and 126: 123 − El segundo grupo incluye ma
- Page 127 and 128: 125 4.3.1.1 Evolución temporal de
- Page 129 and 130: 35% 30% 25% 20% 15% 10% 5% 0% 1749
- Page 131 and 132: 129 peso sobre todo en la zona sur
- Page 133 and 134: 131 Figura 21. Porcentaje de muerte
- Page 135 and 136: 133 Tabla 9. Numero de muertes por
- Page 137 and 138: 29-364 7-28 0-6 Vacío 135 0% 20% 4
- Page 139 and 140: 35% 30% 25% 20% 15% 10% 5% 0% 137 F
- Page 141 and 142: 139 Se obtienen también 53 años d
- Page 143 and 144: 141 regiones 15 y 16, y el sureste
- Page 145 and 146: 143 Figura 28. Mapa de parte de Fin
- Page 147 and 148: 145 Figura 29. Porcentaje de muerte
- Page 149 and 150: 147 sufrido tanto. Este es el caso
- Page 151 and 152: 149 fueron mejores de lo normal. Po
- Page 153 and 154: 151 Periodo Núm. de muertes Distri
- Page 155 and 156: 153 Periodo Núm. de muertes Distri
- Page 157 and 158: 155 Periodo Núm. de muertes Distri
- Page 159: 157 Periodo Núm. de muertes Distri
- Page 163 and 164: 161 La primera zona es claramente O
- Page 165 and 166: 163 más achatada de lo normal, con
- Page 167 and 168: 165 achatados que el resto. Estos d
- Page 169 and 170: 167 Puesto que las muertes de solda
- Page 171 and 172: 25 20 15 10 5 0 1749-1753 1755-1762
- Page 173 and 174: 171 35 como en la Tabla 19 no parec
- Page 175 and 176: 173 Figura 40. Porcentaje de muerte
- Page 177 and 178: 175 Figura 41. Porcentaje de muerte
- Page 179 and 180: 177 En la Figura 42 se muestra el p
- Page 181 and 182: 179 La región restante, representa
- Page 183 and 184: 181 Figura 45. Patrón estacional d
- Page 185 and 186: 183 Figura 47. Patrón estacional d
- Page 187 and 188: 185 Figura 49. Patrón estacional d
- Page 189 and 190: 187 Las gastroenteritis agudas de o
- Page 191 and 192: 189 Durante la Guerra de Gustavo II
- Page 193 and 194: 191 Figura 53. Mapa de las regiones
- Page 195 and 196: 5 Viruela 5.1 Principales caracter
- Page 197 and 198: 195 Las lesiones en las membranas m
- Page 199 and 200: 197 considera como Variola major a
- Page 201 and 202: 199 5.1.6.3 Tasa de fatalidad entre
- Page 203 and 204: 201 Para el caso de la viruela se d
- Page 205 and 206: 203 5.1.10.1 Susceptibilidad indivi
- Page 207 and 208: 205 zonas más densamente pobladas,
- Page 209 and 210: 207 enfermedad para comprar algunas
- Page 211 and 212:
209 humanas, especialmente erisipel
- Page 213 and 214:
211 que la viruela sería endémica
- Page 215 and 216:
213 La vacunación contra la viruel
- Page 217 and 218:
5.2 Material para el estudio de la
- Page 219 and 220:
Viruela 4000 3500 3000 2500 2000 15
- Page 221 and 222:
219 5.3.1 Descripción general de l
- Page 223 and 224:
221 citada disminución de la impor
- Page 225 and 226:
30000 25000 20000 15000 10000 5000
- Page 227 and 228:
225 Tabla 25. Número total de muer
- Page 229 and 230:
227 En cuanto a la existencia de un
- Page 231 and 232:
229 Importante factor es asimismo e
- Page 233 and 234:
14% 12% 10% 8% 6% 4% 2% 0% MuertTot
- Page 235 and 236:
85 años 80-84 años 75-79 años 70
- Page 237 and 238:
235 Tabla 28. Distribución de las
- Page 239 and 240:
60% 50% 40% 30% 20% 10% 0% 237 Tota
- Page 241 and 242:
239 No obstante, aunque la serie de
- Page 243 and 244:
241 Tabla 29. Porcentaje de muertes
- Page 245 and 246:
243 determinar el peso jugado en ca
- Page 247 and 248:
245 comunicadas con el exterior y d
- Page 249 and 250:
247 Figura 74. Reservorios de virue
- Page 251 and 252:
1754 Pico 1756 Pico Periodo Núm. d
- Page 253 and 254:
1770 Pico Periodo Núm. de muertes
- Page 255 and 256:
Periodo Núm. de muertes y porcenta
- Page 257 and 258:
1814 Pico Periodo Núm. de muertes
- Page 259 and 260:
Periodo Núm. de muertes y porcenta
- Page 261 and 262:
259 Tabla 33. Porcentajes de muerte
- Page 263 and 264:
261 Figura 76. Frecuencia con la qu
- Page 265 and 266:
263 Tabla 37. Porcentajes mensuales
- Page 267 and 268:
20% 18% 16% 14% 12% 10% 8% 6% 4% 2%
- Page 269 and 270:
267 Figura 80. Proporción de cada
- Page 271 and 272:
9 8 7 6 5 4 3 2 1 0 269 1751-1752 1
- Page 273 and 274:
271 5.3.3 Aproximación geográfica
- Page 275 and 276:
273 Figura 85. Porcentaje anual de
- Page 277 and 278:
275 Figura 87. Porcentaje anual de
- Page 279 and 280:
277 Figura 89. Porcentaje anual de
- Page 281 and 282:
279 Figura 91. Patrón estacional d
- Page 283 and 284:
281 La edad media de muerte para el
- Page 285 and 286:
283 Figura 96. Edad media de muerte
- Page 287 and 288:
285 Tabla 40. Edades medias de muer
- Page 289 and 290:
287 hospedador roedor, quiróptero
- Page 291 and 292:
289 Esta fase pre-eritrocítica tam
- Page 293 and 294:
291 alcanzar los 40-42ºC. En la te
- Page 295 and 296:
293 dos infecciones. En cualquier c
- Page 297 and 298:
295 occidental, en la Guayana y en
- Page 299 and 300:
297 referirse a un aumento estacion
- Page 301 and 302:
299 general inferior al 50%), y tie
- Page 303 and 304:
301 Durante el siglo XIX, el paludi
- Page 305 and 306:
303 2002). De modo que la enfermeda
- Page 307 and 308:
305 La presencia de un único pico
- Page 309 and 310:
6.2 Material para el estudio del pa
- Page 311 and 312:
309 Término Tratamiento en la bibl
- Page 313 and 314:
311 Término Tratamiento en la bibl
- Page 315 and 316:
313 El hecho de ser un término uti
- Page 317 and 318:
315 tendencias generales. La serie
- Page 319 and 320:
16% 12% 8% 4% 0% 317 Raquitismo Vac
- Page 321 and 322:
319 Figura 106. Porcentaje de muert
- Page 323 and 324:
321 entre sí, estando en todos los
- Page 325 and 326:
323 Para el caso del paludismo se h
- Page 327 and 328:
4.5% 4.0% 3.5% 3.0% 2.5% 2.0% 1.5%
- Page 329 and 330:
327 Los periodos de pico son muy im
- Page 331 and 332:
329 Es evidente que no se da una di
- Page 333 and 334:
331 Pero el máximo primaveral no e
- Page 335 and 336:
29-364 7-28 0-6 Vacío 333 0% 20% 4
- Page 337 and 338:
335 La distribución general de las
- Page 339 and 340:
337 1844. De entre ellos el periodo
- Page 341 and 342:
339 Tabla 52. Resumen de las princi
- Page 343 and 344:
Periodo Núm. de muertes y porcenta
- Page 345 and 346:
Periodo Núm. de muertes y porcenta
- Page 347 and 348:
345 * Los años de valle marcados c
- Page 349 and 350:
347 Figura 118. Frecuencia con la q
- Page 351 and 352:
349 Es por esto que se opta por un
- Page 353 and 354:
351 Por el contrario las dos décad
- Page 355 and 356:
353 6.3.2.3 Evolución temporal de
- Page 357 and 358:
30% 25% 20% 15% 10% 5% 0% 355 Valle
- Page 359 and 360:
45 40 35 30 25 20 15 10 5 0 1749- 1
- Page 361 and 362:
359 Figura 128. Porcentaje anual de
- Page 363 and 364:
361 Figura 130. Porcentaje anual de
- Page 365 and 366:
363 Figura 132. Porcentaje anual de
- Page 367 and 368:
365 Figura 135. Patrón estacional
- Page 369 and 370:
367 Figura 137. Mapa de Finlandia c
- Page 371 and 372:
369 Otra posibilidad es que las mue
- Page 373 and 374:
371 Figura 139. Mapa de Finlandia c
- Page 375 and 376:
373 La zona interior es la formada
- Page 377 and 378:
450 400 350 300 250 200 150 100 50
- Page 379 and 380:
377 Tabla 58. Datos relativos a las
- Page 381 and 382:
45 15-45 0-15 379 0% 10% 20% 30% 40
- Page 383 and 384:
381 Figura 146. Comparación entre
- Page 385 and 386:
7 Comparación de las tres causas d
- Page 387 and 388:
385 En la Figura 149 puede verse la
- Page 389 and 390:
Gastroenteritis y viruela 7000 6000
- Page 391 and 392:
389 de posguerra y de crisis de sub
- Page 393 and 394:
391 Este aumento en la mortalidad p
- Page 395 and 396:
393 Figura 156. Mapas de Finlandia
- Page 397 and 398:
395 Figura 159. Mapas de Finlandia
- Page 399 and 400:
397 En la Figura 161 se muestran lo
- Page 401 and 402:
399 Figura 164. Mapas de Finlandia
- Page 403 and 404:
401 debida a gastroenteritis aguda.
- Page 405 and 406:
403 Tabla 62. Porcentaje de muertes
- Page 407 and 408:
25% 20% 15% 10% 5% 0% Viruela Gastr
- Page 409 and 410:
25% 20% 15% 10% 5% 0% Viruela Gastr
- Page 411 and 412:
40% 35% 30% 25% 20% 15% 10% 5% 0% 4
- Page 413 and 414:
25% 20% 15% 10% 5% 0% 15-19 años V
- Page 415 and 416:
413 En la Figura 178 se muestra la
- Page 417 and 418:
415 − Tras uno de estos important
- Page 419 and 420:
417 población. Los periodos de dur
- Page 421 and 422:
419 Industry and commerce were poor
- Page 423 and 424:
− Name of the person. − Parish
- Page 425 and 426:
423 3.2 Methods The parish records
- Page 427 and 428:
425 Most of these infections are wa
- Page 429 and 430:
427 Table 3. Number of deaths due t
- Page 431 and 432:
429 Gastroenteric diseases show an
- Page 433 and 434:
431 where the percentage rises up t
- Page 435 and 436:
433 Fig. 6. Percentage of deaths at
- Page 437 and 438:
435 6.2 Acute gastroenteritis − D
- Page 439 and 440:
437 6.4 Malaria − Malaria was end
- Page 441 and 442:
439 Forsius A (1994) Mätäkuu, mui
- Page 443 and 444:
441 Núñez M, Torres X & Paavola K
- Page 445 and 446:
443 Warrell DA (1993) Clinical feat
- Page 447 and 448:
445 Tabla 63. Tabla de causas de mu
- Page 449 and 450:
447 Tabla 65. Tabla de causas de mu
- Page 451 and 452:
Anexo 2 Muertes por gastroenteritis
- Page 453 and 454:
451 Parroquias Muertes Gastroenteri
- Page 455 and 456:
453 Parroquias Muertes Gastroenteri
- Page 457:
455 Parroquias Muertes Gastroenteri
- Page 460 and 461:
458 Rödsot (Grupo 1) Significado o
- Page 462 and 463:
460 Lifsjuka (Grupo 1) Significado
- Page 464 and 465:
462 Magref (Grupo 2) Significado o
- Page 466 and 467:
464 Bukref (Grupo 2) Significado o
- Page 468 and 469:
466 Magsjuka (Grupo 2) Significado
- Page 470 and 471:
468 Diarrhè (Grupo 2) Significado
- Page 472 and 473:
470 Colik (Grupo 2) Significado o e
- Page 474 and 475:
472 Magplåga (Grupo 2) Significado
- Page 476 and 477:
474 Uppkastning (Grupo 3) Significa
- Page 478 and 479:
476 Förstoppning (Grupo 3) Signifi
- Page 480 and 481:
478 Durchlopp (Grupo 3) Significado
- Page 482 and 483:
480 Magtorsk (Grupo 3) Significado
- Page 484 and 485:
Utsot (Grupo 3) 482 Significado o e
- Page 486 and 487:
484 Magflen (Grupo 3) Significado o
- Page 488 and 489:
486 Gastrisk feber (Grupo 3) Signif
- Page 490 and 491:
488 Las causas de muerte pertenecie