262 Tab<strong>la</strong> 35. Porcentajes mensuales <strong>de</strong> muertes por virue<strong>la</strong> en cada periodo catalogado como <strong>de</strong> pico (1). Parroquias <strong>de</strong> Fin<strong>la</strong>ndia 1749-1850. Periodos <strong>de</strong> pico (1) 1754 1756 1761-1763 1768 1770 1776-1778 1781-1785 Casos 824 1546 3764 899 2064 3547 6461 Vacío 2,43% 2,20% 1,51% 0,11% 2,08% 0,28% 0,33% Ene 2,91% 4,53% 4,91% 7,45% 7,32% 6,96% 7,51% Feb 6,07% 4,27% 4,91% 9,23% 9,88% 7,39% 7,42% Mar 7,04% 5,95% 5,98% 8,34% 11,39% 7,72% 9,20% Abr 11,04% 11,06% 7,33% 8,79% 10,85% 10,69% 11,69% May 18,93% 11,97% 11,80% 8,23% 13,37% 13,67% 13,97% Jun 18,08% 11,19% 13,02% 8,01% 10,90% 10,43% 9,37% Jul 8,62% 12,29% 12,65% 8,34% 9,35% 7,84% 8,67% Ago 5,10% 11,25% 8,48% 8,68% 9,11% 6,71% 8,36% Sep 5,83% 8,73% 6,93% 7,12% 5,18% 5,84% 6,58% Oct 5,34% 7,50% 7,17% 7,01% 4,02% 6,46% 5,98% Nov 4,37% 5,63% 8,26% 8,68% 3,39% 8,35% 5,36% Dic 4,25% 3,43% 7,04% 10,01% 3,15% 7,67% 5,59% Tab<strong>la</strong> 36. Porcentajes mensuales <strong>de</strong> muertes por virue<strong>la</strong> en cada periodo catalogado como <strong>de</strong> pico (2). Parroquias <strong>de</strong> Fin<strong>la</strong>ndia 1749-1850. Periodos <strong>de</strong> pico (2) 1789 1793-1794 1798-1799 1803-1804 1814 1823 1833 Casos 1639 4334 3953 4905 2702 1552 3036 Vacío 1,34% 0,74% 1,42% 0,69% 0,93% 0,19% 1,28% Ene 11,04% 6,14% 4,38% 4,30% 5,26% 12,95% 17,13% Feb 11,23% 6,74% 5,29% 3,98% 5,14% 9,86% 21,77% Mar 13,30% 8,35% 6,48% 5,34% 9,07% 9,41% 17,65% Abr 12,63% 11,95% 11,21% 8,83% 13,73% 9,34% 15,78% May 12,81% 12,62% 14,32% 11,66% 20,36% 10,44% 11,53% Jun 9,09% 10,64% 13,26% 13,62% 17,17% 9,66% 7,21% Jul 7,75% 10,61% 11,08% 15,03% 11,92% 7,41% 3,85% Ago 4,76% 7,01% 8,40% 10,56% 5,63% 5,67% 1,78% Sep 4,64% 5,84% 6,02% 7,56% 3,85% 5,03% 1,09% Oct 4,21% 6,41% 6,07% 6,42% 2,70% 5,93% 0,30% Nov 4,58% 6,60% 5,46% 6,26% 2,41% 6,51% 0,40% Dic 2,62% 6,35% 6,63% 5,75% 1,85% 7,60% 0,23%
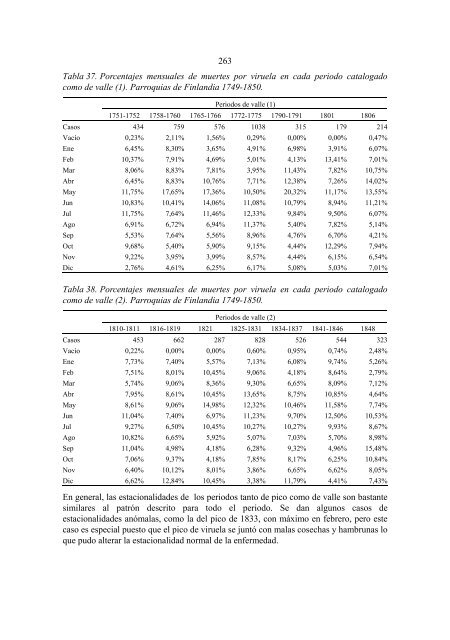
263 Tab<strong>la</strong> 37. Porcentajes mensuales <strong>de</strong> muertes por virue<strong>la</strong> en cada periodo catalogado como <strong>de</strong> valle (1). Parroquias <strong>de</strong> Fin<strong>la</strong>ndia 1749-1850. Periodos <strong>de</strong> valle (1) 1751-1752 1758-1760 1765-1766 1772-1775 1790-1791 1801 1806 Casos 434 759 576 1038 315 179 214 Vacío 0,23% 2,11% 1,56% 0,29% 0,00% 0,00% 0,47% Ene 6,45% 8,30% 3,65% 4,91% 6,98% 3,91% 6,07% Feb 10,37% 7,91% 4,69% 5,01% 4,13% 13,41% 7,01% Mar 8,06% 8,83% 7,81% 3,95% 11,43% 7,82% 10,75% Abr 6,45% 8,83% 10,76% 7,71% 12,38% 7,26% 14,02% May 11,75% 17,65% 17,36% 10,50% 20,32% 11,17% 13,55% Jun 10,83% 10,41% 14,06% 11,08% 10,79% 8,94% 11,21% Jul 11,75% 7,64% 11,46% 12,33% 9,84% 9,50% 6,07% Ago 6,91% 6,72% 6,94% 11,37% 5,40% 7,82% 5,14% Sep 5,53% 7,64% 5,56% 8,96% 4,76% 6,70% 4,21% Oct 9,68% 5,40% 5,90% 9,15% 4,44% 12,29% 7,94% Nov 9,22% 3,95% 3,99% 8,57% 4,44% 6,15% 6,54% Dic 2,76% 4,61% 6,25% 6,17% 5,08% 5,03% 7,01% Tab<strong>la</strong> 38. Porcentajes mensuales <strong>de</strong> muertes por virue<strong>la</strong> en cada periodo catalogado como <strong>de</strong> valle (2). Parroquias <strong>de</strong> Fin<strong>la</strong>ndia 1749-1850. Periodos <strong>de</strong> valle (2) 1810-1811 1816-1819 1821 1825-1831 1834-1837 1841-1846 1848 Casos 453 662 287 828 526 544 323 Vacío 0,22% 0,00% 0,00% 0,60% 0,95% 0,74% 2,48% Ene 7,73% 7,40% 5,57% 7,13% 6,08% 9,74% 5,26% Feb 7,51% 8,01% 10,45% 9,06% 4,18% 8,64% 2,79% Mar 5,74% 9,06% 8,36% 9,30% 6,65% 8,09% 7,12% Abr 7,95% 8,61% 10,45% 13,65% 8,75% 10,85% 4,64% May 8,61% 9,06% 14,98% 12,32% 10,46% 11,58% 7,74% Jun 11,04% 7,40% 6,97% 11,23% 9,70% 12,50% 10,53% Jul 9,27% 6,50% 10,45% 10,27% 10,27% 9,93% 8,67% Ago 10,82% 6,65% 5,92% 5,07% 7,03% 5,70% 8,98% Sep 11,04% 4,98% 4,18% 6,28% 9,32% 4,96% 15,48% Oct 7,06% 9,37% 4,18% 7,85% 8,17% 6,25% 10,84% Nov 6,40% 10,12% 8,01% 3,86% 6,65% 6,62% 8,05% Dic 6,62% 12,84% 10,45% 3,38% 11,79% 4,41% 7,43% En general, <strong>la</strong>s estacionalida<strong>de</strong>s <strong>de</strong> los periodos tanto <strong>de</strong> pico como <strong>de</strong> valle son bastante simi<strong>la</strong>res al patrón <strong>de</strong>scrito para todo el periodo. Se dan algunos casos <strong>de</strong> estacionalida<strong>de</strong>s anóma<strong>la</strong>s, como <strong>la</strong> <strong>de</strong>l pico <strong>de</strong> 1833, con máximo en febrero, pero este caso es especial puesto que el pico <strong>de</strong> virue<strong>la</strong> se juntó con ma<strong>la</strong>s cosechas y hambrunas lo que pudo alterar <strong>la</strong> estacionalidad normal <strong>de</strong> <strong>la</strong> enfermedad.
- Page 1:
IMPORTANCIA DE LA VIRUELA, GASTROEN
- Page 4 and 5:
Copyright © 2005 University of Oul
- Page 7:
Xaviera, Torres Joerges, Importanci
- Page 11:
A mis padres y a mi hermano
- Page 14 and 15:
mucho, y si no que se lo pregunten
- Page 16 and 17:
Tabla 10. Distribución de las muer
- Page 18 and 19:
Tabla 46. Causas de muerte consider
- Page 21 and 22:
Índice de figuras Figura 1. Altitu
- Page 23 and 24:
Figura 24. Distribución de las mue
- Page 25 and 26:
Figura 48. Patrón estacional de la
- Page 27 and 28:
Figura 72. Porcentaje de muertes de
- Page 29 and 30:
Figura 94. Edad media de muerte por
- Page 31 and 32:
Figura 120. Distribución mensual d
- Page 33 and 34:
Figura 139. Mapa de Finlandia con l
- Page 35:
Figura 169. Número mensual de muer
- Page 38 and 39:
3 Material y métodos..............
- Page 40 and 41:
5.3.2 Aproximación temporal ......
- Page 43 and 44:
Prefacio Los trabajos que, como és
- Page 45:
43 y desarrollado en sus posteriore
- Page 48 and 49:
46 1.1 Medio físico 1.1.1 Marco ge
- Page 50 and 51:
48 Figura 2. Porcentaje de superfic
- Page 52 and 53:
50 En términos de geografía polí
- Page 54 and 55:
52 este clima la temperatura media
- Page 56 and 57:
54 siendo sustituida, en gran magni
- Page 58 and 59:
56 región sur, aprovechando lo exc
- Page 60 and 61:
58 Figura 9 en la que se representa
- Page 62:
60 1.2.2 Estructura de la població
- Page 65 and 66:
63 densidad de población podía es
- Page 67 and 68:
65 1.3 Marco histórico 1.3.1 Histo
- Page 69 and 70:
67 desconfiaban de la capacidad de
- Page 71 and 72:
69 También en 1812, los territorio
- Page 73 and 74:
71 ya se utilizaban desde el siglo
- Page 75 and 76:
73 En cuanto a la salud pública pu
- Page 77 and 78:
2 Objetivos El principal objetivo d
- Page 79 and 80:
3 Material y métodos 3.1 Material
- Page 81 and 82:
79 Toda esta labor recaía sobre lo
- Page 83 and 84:
81 − No todas las parroquias pert
- Page 85 and 86:
100% 90% 80% 70% 60% 50% 40% 30% 20
- Page 87 and 88:
85 Parroquia Años con datos Años
- Page 89 and 90:
87 Parroquia Años con datos Años
- Page 91 and 92:
89 Parroquia Años con datos Años
- Page 93 and 94:
91 menciona la edad al momento de l
- Page 95 and 96:
93 El número total de registros qu
- Page 97 and 98:
95 fiables (Pitkänen 1977). Alguno
- Page 99 and 100:
97 Tabla 4. Registros de bautismo u
- Page 101 and 102:
99 Para agrupar los datos procedent
- Page 103 and 104:
101 serán, una vez establecidos, u
- Page 105 and 106:
103 El segundo índice pretende med
- Page 107 and 108:
4 Gastroenteritis 4.1 Principales c
- Page 109 and 110:
107 Bacterias del género Shigella.
- Page 111 and 112:
109 La salmonela tífica sobrevive
- Page 113 and 114:
111 Existen otros patógenos bacter
- Page 115 and 116:
113 sin ocasionar daños pero bajo
- Page 117 and 118:
115 4.1.2.2 Vías de transmisión L
- Page 119 and 120:
117 aumento de la incidencia enferm
- Page 121 and 122:
119 1971), lo que coincide con la e
- Page 123 and 124:
121 Tabla 6. Causas de muerte relac
- Page 125 and 126:
123 − El segundo grupo incluye ma
- Page 127 and 128:
125 4.3.1.1 Evolución temporal de
- Page 129 and 130:
35% 30% 25% 20% 15% 10% 5% 0% 1749
- Page 131 and 132:
129 peso sobre todo en la zona sur
- Page 133 and 134:
131 Figura 21. Porcentaje de muerte
- Page 135 and 136:
133 Tabla 9. Numero de muertes por
- Page 137 and 138:
29-364 7-28 0-6 Vacío 135 0% 20% 4
- Page 139 and 140:
35% 30% 25% 20% 15% 10% 5% 0% 137 F
- Page 141 and 142:
139 Se obtienen también 53 años d
- Page 143 and 144:
141 regiones 15 y 16, y el sureste
- Page 145 and 146:
143 Figura 28. Mapa de parte de Fin
- Page 147 and 148:
145 Figura 29. Porcentaje de muerte
- Page 149 and 150:
147 sufrido tanto. Este es el caso
- Page 151 and 152:
149 fueron mejores de lo normal. Po
- Page 153 and 154:
151 Periodo Núm. de muertes Distri
- Page 155 and 156:
153 Periodo Núm. de muertes Distri
- Page 157 and 158:
155 Periodo Núm. de muertes Distri
- Page 159 and 160:
157 Periodo Núm. de muertes Distri
- Page 161 and 162:
159 Tabla 15. Porcentajes de muerte
- Page 163 and 164:
161 La primera zona es claramente O
- Page 165 and 166:
163 más achatada de lo normal, con
- Page 167 and 168:
165 achatados que el resto. Estos d
- Page 169 and 170:
167 Puesto que las muertes de solda
- Page 171 and 172:
25 20 15 10 5 0 1749-1753 1755-1762
- Page 173 and 174:
171 35 como en la Tabla 19 no parec
- Page 175 and 176:
173 Figura 40. Porcentaje de muerte
- Page 177 and 178:
175 Figura 41. Porcentaje de muerte
- Page 179 and 180:
177 En la Figura 42 se muestra el p
- Page 181 and 182:
179 La región restante, representa
- Page 183 and 184:
181 Figura 45. Patrón estacional d
- Page 185 and 186:
183 Figura 47. Patrón estacional d
- Page 187 and 188:
185 Figura 49. Patrón estacional d
- Page 189 and 190:
187 Las gastroenteritis agudas de o
- Page 191 and 192:
189 Durante la Guerra de Gustavo II
- Page 193 and 194:
191 Figura 53. Mapa de las regiones
- Page 195 and 196:
5 Viruela 5.1 Principales caracter
- Page 197 and 198:
195 Las lesiones en las membranas m
- Page 199 and 200:
197 considera como Variola major a
- Page 201 and 202:
199 5.1.6.3 Tasa de fatalidad entre
- Page 203 and 204:
201 Para el caso de la viruela se d
- Page 205 and 206:
203 5.1.10.1 Susceptibilidad indivi
- Page 207 and 208:
205 zonas más densamente pobladas,
- Page 209 and 210:
207 enfermedad para comprar algunas
- Page 211 and 212:
209 humanas, especialmente erisipel
- Page 213 and 214: 211 que la viruela sería endémica
- Page 215 and 216: 213 La vacunación contra la viruel
- Page 217 and 218: 5.2 Material para el estudio de la
- Page 219 and 220: Viruela 4000 3500 3000 2500 2000 15
- Page 221 and 222: 219 5.3.1 Descripción general de l
- Page 223 and 224: 221 citada disminución de la impor
- Page 225 and 226: 30000 25000 20000 15000 10000 5000
- Page 227 and 228: 225 Tabla 25. Número total de muer
- Page 229 and 230: 227 En cuanto a la existencia de un
- Page 231 and 232: 229 Importante factor es asimismo e
- Page 233 and 234: 14% 12% 10% 8% 6% 4% 2% 0% MuertTot
- Page 235 and 236: 85 años 80-84 años 75-79 años 70
- Page 237 and 238: 235 Tabla 28. Distribución de las
- Page 239 and 240: 60% 50% 40% 30% 20% 10% 0% 237 Tota
- Page 241 and 242: 239 No obstante, aunque la serie de
- Page 243 and 244: 241 Tabla 29. Porcentaje de muertes
- Page 245 and 246: 243 determinar el peso jugado en ca
- Page 247 and 248: 245 comunicadas con el exterior y d
- Page 249 and 250: 247 Figura 74. Reservorios de virue
- Page 251 and 252: 1754 Pico 1756 Pico Periodo Núm. d
- Page 253 and 254: 1770 Pico Periodo Núm. de muertes
- Page 255 and 256: Periodo Núm. de muertes y porcenta
- Page 257 and 258: 1814 Pico Periodo Núm. de muertes
- Page 259 and 260: Periodo Núm. de muertes y porcenta
- Page 261 and 262: 259 Tabla 33. Porcentajes de muerte
- Page 263: 261 Figura 76. Frecuencia con la qu
- Page 267 and 268: 20% 18% 16% 14% 12% 10% 8% 6% 4% 2%
- Page 269 and 270: 267 Figura 80. Proporción de cada
- Page 271 and 272: 9 8 7 6 5 4 3 2 1 0 269 1751-1752 1
- Page 273 and 274: 271 5.3.3 Aproximación geográfica
- Page 275 and 276: 273 Figura 85. Porcentaje anual de
- Page 277 and 278: 275 Figura 87. Porcentaje anual de
- Page 279 and 280: 277 Figura 89. Porcentaje anual de
- Page 281 and 282: 279 Figura 91. Patrón estacional d
- Page 283 and 284: 281 La edad media de muerte para el
- Page 285 and 286: 283 Figura 96. Edad media de muerte
- Page 287 and 288: 285 Tabla 40. Edades medias de muer
- Page 289 and 290: 287 hospedador roedor, quiróptero
- Page 291 and 292: 289 Esta fase pre-eritrocítica tam
- Page 293 and 294: 291 alcanzar los 40-42ºC. En la te
- Page 295 and 296: 293 dos infecciones. En cualquier c
- Page 297 and 298: 295 occidental, en la Guayana y en
- Page 299 and 300: 297 referirse a un aumento estacion
- Page 301 and 302: 299 general inferior al 50%), y tie
- Page 303 and 304: 301 Durante el siglo XIX, el paludi
- Page 305 and 306: 303 2002). De modo que la enfermeda
- Page 307 and 308: 305 La presencia de un único pico
- Page 309 and 310: 6.2 Material para el estudio del pa
- Page 311 and 312: 309 Término Tratamiento en la bibl
- Page 313 and 314: 311 Término Tratamiento en la bibl
- Page 315 and 316:
313 El hecho de ser un término uti
- Page 317 and 318:
315 tendencias generales. La serie
- Page 319 and 320:
16% 12% 8% 4% 0% 317 Raquitismo Vac
- Page 321 and 322:
319 Figura 106. Porcentaje de muert
- Page 323 and 324:
321 entre sí, estando en todos los
- Page 325 and 326:
323 Para el caso del paludismo se h
- Page 327 and 328:
4.5% 4.0% 3.5% 3.0% 2.5% 2.0% 1.5%
- Page 329 and 330:
327 Los periodos de pico son muy im
- Page 331 and 332:
329 Es evidente que no se da una di
- Page 333 and 334:
331 Pero el máximo primaveral no e
- Page 335 and 336:
29-364 7-28 0-6 Vacío 333 0% 20% 4
- Page 337 and 338:
335 La distribución general de las
- Page 339 and 340:
337 1844. De entre ellos el periodo
- Page 341 and 342:
339 Tabla 52. Resumen de las princi
- Page 343 and 344:
Periodo Núm. de muertes y porcenta
- Page 345 and 346:
Periodo Núm. de muertes y porcenta
- Page 347 and 348:
345 * Los años de valle marcados c
- Page 349 and 350:
347 Figura 118. Frecuencia con la q
- Page 351 and 352:
349 Es por esto que se opta por un
- Page 353 and 354:
351 Por el contrario las dos décad
- Page 355 and 356:
353 6.3.2.3 Evolución temporal de
- Page 357 and 358:
30% 25% 20% 15% 10% 5% 0% 355 Valle
- Page 359 and 360:
45 40 35 30 25 20 15 10 5 0 1749- 1
- Page 361 and 362:
359 Figura 128. Porcentaje anual de
- Page 363 and 364:
361 Figura 130. Porcentaje anual de
- Page 365 and 366:
363 Figura 132. Porcentaje anual de
- Page 367 and 368:
365 Figura 135. Patrón estacional
- Page 369 and 370:
367 Figura 137. Mapa de Finlandia c
- Page 371 and 372:
369 Otra posibilidad es que las mue
- Page 373 and 374:
371 Figura 139. Mapa de Finlandia c
- Page 375 and 376:
373 La zona interior es la formada
- Page 377 and 378:
450 400 350 300 250 200 150 100 50
- Page 379 and 380:
377 Tabla 58. Datos relativos a las
- Page 381 and 382:
45 15-45 0-15 379 0% 10% 20% 30% 40
- Page 383 and 384:
381 Figura 146. Comparación entre
- Page 385 and 386:
7 Comparación de las tres causas d
- Page 387 and 388:
385 En la Figura 149 puede verse la
- Page 389 and 390:
Gastroenteritis y viruela 7000 6000
- Page 391 and 392:
389 de posguerra y de crisis de sub
- Page 393 and 394:
391 Este aumento en la mortalidad p
- Page 395 and 396:
393 Figura 156. Mapas de Finlandia
- Page 397 and 398:
395 Figura 159. Mapas de Finlandia
- Page 399 and 400:
397 En la Figura 161 se muestran lo
- Page 401 and 402:
399 Figura 164. Mapas de Finlandia
- Page 403 and 404:
401 debida a gastroenteritis aguda.
- Page 405 and 406:
403 Tabla 62. Porcentaje de muertes
- Page 407 and 408:
25% 20% 15% 10% 5% 0% Viruela Gastr
- Page 409 and 410:
25% 20% 15% 10% 5% 0% Viruela Gastr
- Page 411 and 412:
40% 35% 30% 25% 20% 15% 10% 5% 0% 4
- Page 413 and 414:
25% 20% 15% 10% 5% 0% 15-19 años V
- Page 415 and 416:
413 En la Figura 178 se muestra la
- Page 417 and 418:
415 − Tras uno de estos important
- Page 419 and 420:
417 población. Los periodos de dur
- Page 421 and 422:
419 Industry and commerce were poor
- Page 423 and 424:
− Name of the person. − Parish
- Page 425 and 426:
423 3.2 Methods The parish records
- Page 427 and 428:
425 Most of these infections are wa
- Page 429 and 430:
427 Table 3. Number of deaths due t
- Page 431 and 432:
429 Gastroenteric diseases show an
- Page 433 and 434:
431 where the percentage rises up t
- Page 435 and 436:
433 Fig. 6. Percentage of deaths at
- Page 437 and 438:
435 6.2 Acute gastroenteritis − D
- Page 439 and 440:
437 6.4 Malaria − Malaria was end
- Page 441 and 442:
439 Forsius A (1994) Mätäkuu, mui
- Page 443 and 444:
441 Núñez M, Torres X & Paavola K
- Page 445 and 446:
443 Warrell DA (1993) Clinical feat
- Page 447 and 448:
445 Tabla 63. Tabla de causas de mu
- Page 449 and 450:
447 Tabla 65. Tabla de causas de mu
- Page 451 and 452:
Anexo 2 Muertes por gastroenteritis
- Page 453 and 454:
451 Parroquias Muertes Gastroenteri
- Page 455 and 456:
453 Parroquias Muertes Gastroenteri
- Page 457:
455 Parroquias Muertes Gastroenteri
- Page 460 and 461:
458 Rödsot (Grupo 1) Significado o
- Page 462 and 463:
460 Lifsjuka (Grupo 1) Significado
- Page 464 and 465:
462 Magref (Grupo 2) Significado o
- Page 466 and 467:
464 Bukref (Grupo 2) Significado o
- Page 468 and 469:
466 Magsjuka (Grupo 2) Significado
- Page 470 and 471:
468 Diarrhè (Grupo 2) Significado
- Page 472 and 473:
470 Colik (Grupo 2) Significado o e
- Page 474 and 475:
472 Magplåga (Grupo 2) Significado
- Page 476 and 477:
474 Uppkastning (Grupo 3) Significa
- Page 478 and 479:
476 Förstoppning (Grupo 3) Signifi
- Page 480 and 481:
478 Durchlopp (Grupo 3) Significado
- Page 482 and 483:
480 Magtorsk (Grupo 3) Significado
- Page 484 and 485:
Utsot (Grupo 3) 482 Significado o e
- Page 486 and 487:
484 Magflen (Grupo 3) Significado o
- Page 488 and 489:
486 Gastrisk feber (Grupo 3) Signif
- Page 490 and 491:
488 Las causas de muerte pertenecie