Importancia de la viruela, gastroenteritis aguda y paludismo ... - Oulu
Importancia de la viruela, gastroenteritis aguda y paludismo ... - Oulu
Importancia de la viruela, gastroenteritis aguda y paludismo ... - Oulu

You also want an ePaper? Increase the reach of your titles
YUMPU automatically turns print PDFs into web optimized ePapers that Google loves.
241<br />
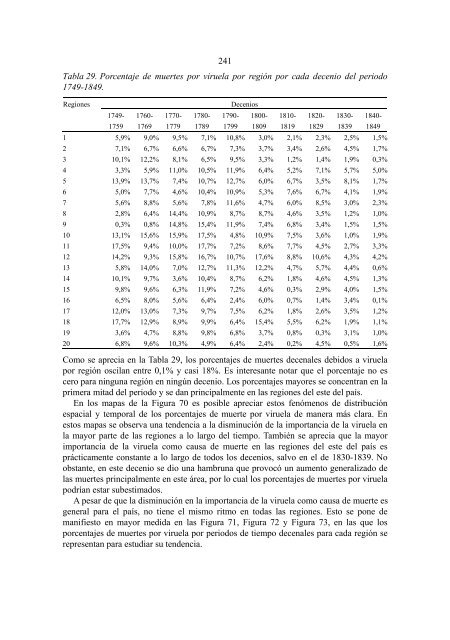
Tab<strong>la</strong> 29. Porcentaje <strong>de</strong> muertes por virue<strong>la</strong> por región por cada <strong>de</strong>cenio <strong>de</strong>l periodo<br />
1749-1849.<br />
Regiones<br />
Decenios<br />
1749- 1760- 1770- 1780- 1790- 1800- 1810- 1820- 1830- 1840-<br />
1759 1769 1779 1789 1799 1809 1819 1829 1839 1849<br />
1 5,9% 9,0% 9,5% 7,1% 10,8% 3,0% 2,1% 2,3% 2,5% 1,5%<br />
2 7,1% 6,7% 6,6% 6,7% 7,3% 3,7% 3,4% 2,6% 4,5% 1,7%<br />
3 10,1% 12,2% 8,1% 6,5% 9,5% 3,3% 1,2% 1,4% 1,9% 0,3%<br />
4 3,3% 5,9% 11,0% 10,5% 11,9% 6,4% 5,2% 7,1% 5,7% 5,0%<br />
5 13,9% 13,7% 7,4% 10,7% 12,7% 6,0% 6,7% 3,5% 8,1% 1,7%<br />
6 5,0% 7,7% 4,6% 10,4% 10,9% 5,3% 7,6% 6,7% 4,1% 1,9%<br />
7 5,6% 8,8% 5,6% 7,8% 11,6% 4,7% 6,0% 8,5% 3,0% 2,3%<br />
8 2,8% 6,4% 14,4% 10,9% 8,7% 8,7% 4,6% 3,5% 1,2% 1,0%<br />
9 0,3% 0,8% 14,8% 15,4% 11,9% 7,4% 6,8% 3,4% 1,5% 1,5%<br />
10 13,1% 15,6% 15,9% 17,5% 4,8% 10,9% 7,5% 3,6% 1,0% 1,9%<br />
11 17,5% 9,4% 10,0% 17,7% 7,2% 8,6% 7,7% 4,5% 2,7% 3,3%<br />
12 14,2% 9,3% 15,8% 16,7% 10,7% 17,6% 8,8% 10,6% 4,3% 4,2%<br />
13 5,8% 14,0% 7,0% 12,7% 11,3% 12,2% 4,7% 5,7% 4,4% 0,6%<br />
14 10,1% 9,7% 3,6% 10,4% 8,7% 6,2% 1,8% 4,6% 4,5% 1,3%<br />
15 9,8% 9,6% 6,3% 11,9% 7,2% 4,6% 0,3% 2,9% 4,0% 1,5%<br />
16 6,5% 8,0% 5,6% 6,4% 2,4% 6,0% 0,7% 1,4% 3,4% 0,1%<br />
17 12,0% 13,0% 7,3% 9,7% 7,5% 6,2% 1,8% 2,6% 3,5% 1,2%<br />
18 17,7% 12,9% 8,9% 9,9% 6,4% 15,4% 5,5% 6,2% 1,9% 1,1%<br />
19 3,6% 4,7% 8,8% 9,8% 6,8% 3,7% 0,8% 0,3% 3,1% 1,0%<br />
20 6,8% 9,6% 10,3% 4,9% 6,4% 2,4% 0,2% 4,5% 0,5% 1,6%<br />
Como se aprecia en <strong>la</strong> Tab<strong>la</strong> 29, los porcentajes <strong>de</strong> muertes <strong>de</strong>cenales <strong>de</strong>bidos a virue<strong>la</strong><br />
por región osci<strong>la</strong>n entre 0,1% y casi 18%. Es interesante notar que el porcentaje no es<br />
cero para ninguna región en ningún <strong>de</strong>cenio. Los porcentajes mayores se concentran en <strong>la</strong><br />
primera mitad <strong>de</strong>l periodo y se dan principalmente en <strong>la</strong>s regiones <strong>de</strong>l este <strong>de</strong>l país.<br />
En los mapas <strong>de</strong> <strong>la</strong> Figura 70 es posible apreciar estos fenómenos <strong>de</strong> distribución<br />
espacial y temporal <strong>de</strong> los porcentajes <strong>de</strong> muerte por virue<strong>la</strong> <strong>de</strong> manera más c<strong>la</strong>ra. En<br />
estos mapas se observa una ten<strong>de</strong>ncia a <strong>la</strong> disminución <strong>de</strong> <strong>la</strong> importancia <strong>de</strong> <strong>la</strong> virue<strong>la</strong> en<br />
<strong>la</strong> mayor parte <strong>de</strong> <strong>la</strong>s regiones a lo <strong>la</strong>rgo <strong>de</strong>l tiempo. También se aprecia que <strong>la</strong> mayor<br />
importancia <strong>de</strong> <strong>la</strong> virue<strong>la</strong> como causa <strong>de</strong> muerte en <strong>la</strong>s regiones <strong>de</strong>l este <strong>de</strong>l país es<br />
prácticamente constante a lo <strong>la</strong>rgo <strong>de</strong> todos los <strong>de</strong>cenios, salvo en el <strong>de</strong> 1830-1839. No<br />
obstante, en este <strong>de</strong>cenio se dio una hambruna que provocó un aumento generalizado <strong>de</strong><br />
<strong>la</strong>s muertes principalmente en este área, por lo cual los porcentajes <strong>de</strong> muertes por virue<strong>la</strong><br />
podrían estar subestimados.<br />
A pesar <strong>de</strong> que <strong>la</strong> disminución en <strong>la</strong> importancia <strong>de</strong> <strong>la</strong> virue<strong>la</strong> como causa <strong>de</strong> muerte es<br />
general para el país, no tiene el mismo ritmo en todas <strong>la</strong>s regiones. Esto se pone <strong>de</strong><br />
manifiesto en mayor medida en <strong>la</strong>s Figura 71, Figura 72 y Figura 73, en <strong>la</strong>s que los<br />
porcentajes <strong>de</strong> muertes por virue<strong>la</strong> por periodos <strong>de</strong> tiempo <strong>de</strong>cenales para cada región se<br />
representan para estudiar su ten<strong>de</strong>ncia.