Importancia de la viruela, gastroenteritis aguda y paludismo ... - Oulu
Importancia de la viruela, gastroenteritis aguda y paludismo ... - Oulu
Importancia de la viruela, gastroenteritis aguda y paludismo ... - Oulu

You also want an ePaper? Increase the reach of your titles
YUMPU automatically turns print PDFs into web optimized ePapers that Google loves.
346<br />
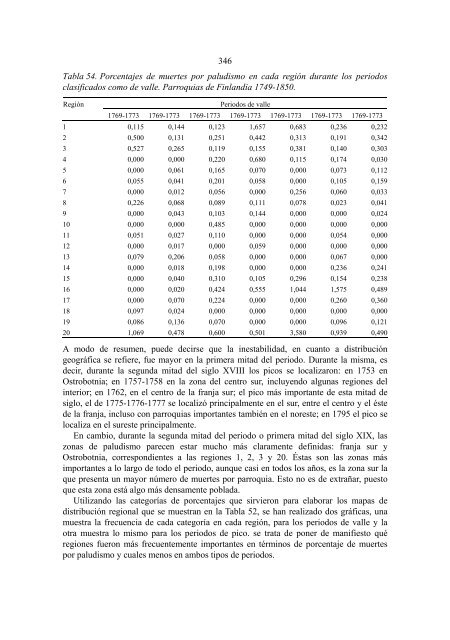
Tab<strong>la</strong> 54. Porcentajes <strong>de</strong> muertes por <strong>paludismo</strong> en cada región durante los periodos<br />
c<strong>la</strong>sificados como <strong>de</strong> valle. Parroquias <strong>de</strong> Fin<strong>la</strong>ndia 1749-1850.<br />
Región<br />
Periodos <strong>de</strong> valle<br />
1769-1773 1769-1773 1769-1773 1769-1773 1769-1773 1769-1773 1769-1773<br />
1 0,115 0,144 0,123 1,657 0,683 0,236 0,232<br />
2 0,500 0,131 0,251 0,442 0,313 0,191 0,342<br />
3 0,527 0,265 0,119 0,155 0,381 0,140 0,303<br />
4 0,000 0,000 0,220 0,680 0,115 0,174 0,030<br />
5 0,000 0,061 0,165 0,070 0,000 0,073 0,112<br />
6 0,055 0,041 0,201 0,058 0,000 0,105 0,159<br />
7 0,000 0,012 0,056 0,000 0,256 0,060 0,033<br />
8 0,226 0,068 0,089 0,111 0,078 0,023 0,041<br />
9 0,000 0,043 0,103 0,144 0,000 0,000 0,024<br />
10 0,000 0,000 0,485 0,000 0,000 0,000 0,000<br />
11 0,051 0,027 0,110 0,000 0,000 0,054 0,000<br />
12 0,000 0,017 0,000 0,059 0,000 0,000 0,000<br />
13 0,079 0,206 0,058 0,000 0,000 0,067 0,000<br />
14 0,000 0,018 0,198 0,000 0,000 0,236 0,241<br />
15 0,000 0,040 0,310 0,105 0,296 0,154 0,238<br />
16 0,000 0,020 0,424 0,555 1,044 1,575 0,489<br />
17 0,000 0,070 0,224 0,000 0,000 0,260 0,360<br />
18 0,097 0,024 0,000 0,000 0,000 0,000 0,000<br />
19 0,086 0,136 0,070 0,000 0,000 0,096 0,121<br />
20 1,069 0,478 0,600 0,501 3,580 0,939 0,490<br />
A modo <strong>de</strong> resumen, pue<strong>de</strong> <strong>de</strong>cirse que <strong>la</strong> inestabilidad, en cuanto a distribución<br />
geográfica se refiere, fue mayor en <strong>la</strong> primera mitad <strong>de</strong>l periodo. Durante <strong>la</strong> misma, es<br />
<strong>de</strong>cir, durante <strong>la</strong> segunda mitad <strong>de</strong>l siglo XVIII los picos se localizaron: en 1753 en<br />
Ostrobotnia; en 1757-1758 en <strong>la</strong> zona <strong>de</strong>l centro sur, incluyendo algunas regiones <strong>de</strong>l<br />
interior; en 1762, en el centro <strong>de</strong> <strong>la</strong> franja sur; el pico más importante <strong>de</strong> esta mitad <strong>de</strong><br />
siglo, el <strong>de</strong> 1775-1776-1777 se localizó principalmente en el sur, entre el centro y el éste<br />
<strong>de</strong> <strong>la</strong> franja, incluso con parroquias importantes también en el noreste; en 1795 el pico se<br />
localiza en el sureste principalmente.<br />
En cambio, durante <strong>la</strong> segunda mitad <strong>de</strong>l periodo o primera mitad <strong>de</strong>l siglo XIX, <strong>la</strong>s<br />
zonas <strong>de</strong> <strong>paludismo</strong> parecen estar mucho más c<strong>la</strong>ramente <strong>de</strong>finidas: franja sur y<br />
Ostrobotnia, correspondientes a <strong>la</strong>s regiones 1, 2, 3 y 20. Éstas son <strong>la</strong>s zonas más<br />
importantes a lo <strong>la</strong>rgo <strong>de</strong> todo el periodo, aunque casi en todos los años, es <strong>la</strong> zona sur <strong>la</strong><br />
que presenta un mayor número <strong>de</strong> muertes por parroquia. Esto no es <strong>de</strong> extrañar, puesto<br />
que esta zona está algo más <strong>de</strong>nsamente pob<strong>la</strong>da.<br />
Utilizando <strong>la</strong>s categorías <strong>de</strong> porcentajes que sirvieron para e<strong>la</strong>borar los mapas <strong>de</strong><br />
distribución regional que se muestran en <strong>la</strong> Tab<strong>la</strong> 52, se han realizado dos gráficas, una<br />
muestra <strong>la</strong> frecuencia <strong>de</strong> cada categoría en cada región, para los periodos <strong>de</strong> valle y <strong>la</strong><br />
otra muestra lo mismo para los periodos <strong>de</strong> pico. se trata <strong>de</strong> poner <strong>de</strong> manifiesto qué<br />
regiones fueron más frecuentemente importantes en términos <strong>de</strong> porcentaje <strong>de</strong> muertes<br />
por <strong>paludismo</strong> y cuales menos en ambos tipos <strong>de</strong> periodos.