Importancia de la viruela, gastroenteritis aguda y paludismo ... - Oulu
Importancia de la viruela, gastroenteritis aguda y paludismo ... - Oulu
Importancia de la viruela, gastroenteritis aguda y paludismo ... - Oulu

Create successful ePaper yourself
Turn your PDF publications into a flip-book with our unique Google optimized e-Paper software.
162<br />
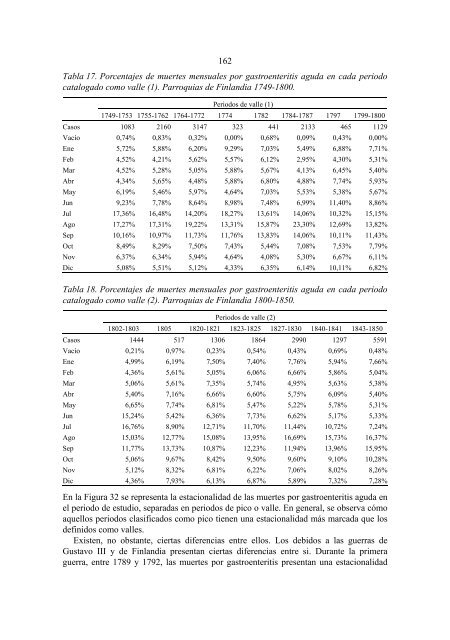
Tab<strong>la</strong> 17. Porcentajes <strong>de</strong> muertes mensuales por <strong>gastroenteritis</strong> <strong>aguda</strong> en cada periodo<br />
catalogado como valle (1). Parroquias <strong>de</strong> Fin<strong>la</strong>ndia 1749-1800.<br />
Periodos <strong>de</strong> valle (1)<br />
1749-1753 1755-1762 1764-1772 1774 1782 1784-1787 1797 1799-1800<br />
Casos 1083 2160 3147 323 441 2133 465 1129<br />
Vacío 0,74% 0,83% 0,32% 0,00% 0,68% 0,09% 0,43% 0,00%<br />
Ene 5,72% 5,88% 6,20% 9,29% 7,03% 5,49% 6,88% 7,71%<br />
Feb 4,52% 4,21% 5,62% 5,57% 6,12% 2,95% 4,30% 5,31%<br />
Mar 4,52% 5,28% 5,05% 5,88% 5,67% 4,13% 6,45% 5,40%<br />
Abr 4,34% 5,65% 4,48% 5,88% 6,80% 4,88% 7,74% 5,93%<br />
May 6,19% 5,46% 5,97% 4,64% 7,03% 5,53% 5,38% 5,67%<br />
Jun 9,23% 7,78% 8,64% 8,98% 7,48% 6,99% 11,40% 8,86%<br />
Jul 17,36% 16,48% 14,20% 18,27% 13,61% 14,06% 10,32% 15,15%<br />
Ago 17,27% 17,31% 19,22% 13,31% 15,87% 23,30% 12,69% 13,82%<br />
Sep 10,16% 10,97% 11,73% 11,76% 13,83% 14,06% 10,11% 11,43%<br />
Oct 8,49% 8,29% 7,50% 7,43% 5,44% 7,08% 7,53% 7,79%<br />
Nov 6,37% 6,34% 5,94% 4,64% 4,08% 5,30% 6,67% 6,11%<br />
Dic 5,08% 5,51% 5,12% 4,33% 6,35% 6,14% 10,11% 6,82%<br />
Tab<strong>la</strong> 18. Porcentajes <strong>de</strong> muertes mensuales por <strong>gastroenteritis</strong> <strong>aguda</strong> en cada periodo<br />
catalogado como valle (2). Parroquias <strong>de</strong> Fin<strong>la</strong>ndia 1800-1850.<br />
Periodos <strong>de</strong> valle (2)<br />
1802-1803 1805 1820-1821 1823-1825 1827-1830 1840-1841 1843-1850<br />
Casos 1444 517 1306 1864 2990 1297 5591<br />
Vacío 0,21% 0,97% 0,23% 0,54% 0,43% 0,69% 0,48%<br />
Ene 4,99% 6,19% 7,50% 7,40% 7,76% 5,94% 7,66%<br />
Feb 4,36% 5,61% 5,05% 6,06% 6,66% 5,86% 5,04%<br />
Mar 5,06% 5,61% 7,35% 5,74% 4,95% 5,63% 5,38%<br />
Abr 5,40% 7,16% 6,66% 6,60% 5,75% 6,09% 5,40%<br />
May 6,65% 7,74% 6,81% 5,47% 5,22% 5,78% 5,31%<br />
Jun 15,24% 5,42% 6,36% 7,73% 6,62% 5,17% 5,33%<br />
Jul 16,76% 8,90% 12,71% 11,70% 11,44% 10,72% 7,24%<br />
Ago 15,03% 12,77% 15,08% 13,95% 16,69% 15,73% 16,37%<br />
Sep 11,77% 13,73% 10,87% 12,23% 11,94% 13,96% 15,95%<br />
Oct 5,06% 9,67% 8,42% 9,50% 9,60% 9,10% 10,28%<br />
Nov 5,12% 8,32% 6,81% 6,22% 7,06% 8,02% 8,26%<br />
Dic 4,36% 7,93% 6,13% 6,87% 5,89% 7,32% 7,28%<br />
En <strong>la</strong> Figura 32 se representa <strong>la</strong> estacionalidad <strong>de</strong> <strong>la</strong>s muertes por <strong>gastroenteritis</strong> <strong>aguda</strong> en<br />
el periodo <strong>de</strong> estudio, separadas en periodos <strong>de</strong> pico o valle. En general, se observa cómo<br />
aquellos periodos c<strong>la</strong>sificados como pico tienen una estacionalidad más marcada que los<br />
<strong>de</strong>finidos como valles.<br />
Existen, no obstante, ciertas diferencias entre ellos. Los <strong>de</strong>bidos a <strong>la</strong>s guerras <strong>de</strong><br />
Gustavo III y <strong>de</strong> Fin<strong>la</strong>ndia presentan ciertas diferencias entre si. Durante <strong>la</strong> primera<br />
guerra, entre 1789 y 1792, <strong>la</strong>s muertes por <strong>gastroenteritis</strong> presentan una estacionalidad