- Page 1 and 2:
Université Pierre et Marie CurieEc
- Page 3 and 4:
3Remerciementstel-00392240, version
- Page 5 and 6:
Table des matièresIntroduction gé
- Page 7 and 8:
TABLE DES MATIÈRES 7tel-00392240,
- Page 9 and 10:
TABLE DES MATIÈRES 9FGParamètres
- Page 11 and 12:
tel-00392240, version 1 - 5 Jun 200
- Page 13 and 14:
Introduction générale 13Contextet
- Page 15 and 16:
Introduction générale 15Probléma
- Page 17 and 18:
Introduction générale 17Crue de d
- Page 19 and 20:
Première partietel-00392240, versi
- Page 21 and 22:
Chapitre 1Apports latéraux dans le
- Page 23 and 24:
Chapitre 1. Apports latéraux dans
- Page 25 and 26:
Chapitre 1. Apports latéraux dans
- Page 27 and 28:
Chapitre 1. Apports latéraux dans
- Page 29 and 30:
Chapitre 1. Apports latéraux dans
- Page 31 and 32:
Chapitre 1. Apports latéraux dans
- Page 33 and 34:
Chapitre 1. Apports latéraux dans
- Page 35 and 36:
Chapitre 1. Apports latéraux dans
- Page 37 and 38:
Chapitre 1. Apports latéraux dans
- Page 39 and 40:
Chapitre 2Présentation de l’éch
- Page 41 and 42:
Chapitre 2. Présentation de l’é
- Page 43 and 44:
Chapitre 2. Présentation de l’é
- Page 45 and 46:
Chapitre 2. Présentation de l’é
- Page 47 and 48:
Chapitre 2. Présentation de l’é
- Page 49 and 50:
Chapitre 2. Présentation de l’é
- Page 51 and 52:
Chapitre 2. Présentation de l’é
- Page 53 and 54:
Chapitre 2. Présentation de l’é
- Page 55 and 56:
Chapitre 2. Présentation de l’é
- Page 57 and 58:
Chapitre 2. Présentation de l’é
- Page 59 and 60:
Chapitre 2. Présentation de l’é
- Page 61 and 62:
Chapitre 3Choix des modèles hydrol
- Page 63 and 64:
Chapitre 3. Choix des modèles hydr
- Page 65 and 66:
Chapitre 3. Choix des modèles hydr
- Page 67 and 68:
Chapitre 3. Choix des modèles hydr
- Page 69 and 70:
Chapitre 3. Choix des modèles hydr
- Page 71 and 72:
Chapitre 3. Choix des modèles hydr
- Page 73 and 74:
Chapitre 3. Choix des modèles hydr
- Page 75 and 76:
Chapitre 3. Choix des modèles hydr
- Page 77 and 78:
Chapitre 3. Choix des modèles hydr
- Page 79 and 80:
Chapitre 3. Choix des modèles hydr
- Page 81 and 82:
Chapitre 3. Choix des modèles hydr
- Page 83 and 84:
Chapitre 3. Choix des modèles hydr
- Page 85 and 86:
Chapitre 3. Choix des modèles hydr
- Page 87 and 88:
Chapitre 3. Choix des modèles hydr
- Page 89 and 90:
Chapitre 4Stratégie de calage et d
- Page 91 and 92:
Chapitre 4. Stratégie de calage et
- Page 93 and 94:
Chapitre 4. Stratégie de calage et
- Page 95 and 96:
Chapitre 4. Stratégie de calage et
- Page 97 and 98:
Chapitre 4. Stratégie de calage et
- Page 99 and 100:
Chapitre 4. Stratégie de calage et
- Page 101 and 102:
Chapitre 4. Stratégie de calage et
- Page 103 and 104:
Chapitre 4. Stratégie de calage et
- Page 105 and 106:
Chapitre 4. Stratégie de calage et
- Page 107 and 108:
Chapitre 4. Stratégie de calage et
- Page 109 and 110:
Chapitre 4. Stratégie de calage et
- Page 111 and 112:
Chapitre 4. Stratégie de calage et
- Page 113 and 114:
Deuxième partietel-00392240, versi
- Page 115 and 116:
Chapitre 5Jusqu’où est-il néces
- Page 117 and 118:
Chapitre 5. Jusqu’où est-il néc
- Page 119 and 120:
Chapitre 5. Jusqu’où est-il néc
- Page 121 and 122:
Chapitre 5. Jusqu’où est-il néc
- Page 123 and 124:
Chapitre 5. Jusqu’où est-il néc
- Page 125 and 126:
Chapitre 5. Jusqu’où est-il néc
- Page 127 and 128:
Chapitre 5. Jusqu’où est-il néc
- Page 129 and 130:
Chapitre 5. Jusqu’où est-il néc
- Page 131 and 132:
Chapitre 5. Jusqu’où est-il néc
- Page 133 and 134:
Chapitre 5. Jusqu’où est-il néc
- Page 135 and 136:
Chapitre 5. Jusqu’où est-il néc
- Page 137 and 138:
Chapitre 5. Jusqu’où est-il néc
- Page 139 and 140:
Chapitre 5. Jusqu’où est-il néc
- Page 141 and 142:
Chapitre 5. Jusqu’où est-il néc
- Page 143 and 144:
Chapitre 6Sensibilité d’un modè
- Page 145 and 146:
Chapitre 6. Sensibilité d’un mod
- Page 147 and 148:
Chapitre 6. Sensibilité d’un mod
- Page 149 and 150:
Chapitre 6. Sensibilité d’un mod
- Page 151 and 152:
Chapitre 6. Sensibilité d’un mod
- Page 153 and 154:
Chapitre 6. Sensibilité d’un mod
- Page 155 and 156:
Chapitre 6. Sensibilité d’un mod
- Page 157 and 158:
Chapitre 6. Sensibilité d’un mod
- Page 159 and 160:
Chapitre 6. Sensibilité d’un mod
- Page 161 and 162:
Chapitre 6. Sensibilité d’un mod
- Page 163 and 164:
Chapitre 6. Sensibilité d’un mod
- Page 165 and 166:
Chapitre 7Simplifications de la str
- Page 167 and 168:
Chapitre 7. Simplifications de la s
- Page 169 and 170:
Chapitre 7. Simplifications de la s
- Page 171 and 172:
Chapitre 7. Simplifications de la s
- Page 173 and 174:
Chapitre 7. Simplifications de la s
- Page 175 and 176:
tel-00392240, version 1 - 5 Jun 200
- Page 177 and 178:
Conclusion générale 177Dans le ca
- Page 179 and 180:
Conclusion générale 179Quel est l
- Page 181 and 182:
BibliographieAbbott, M. et Refsgaar
- Page 183 and 184:
BIBLIOGRAPHIE 183Brutsaert, W. (200
- Page 185 and 186:
BIBLIOGRAPHIE 185Jakeman, A. et Hor
- Page 187 and 188:
BIBLIOGRAPHIE 187MEEDDAT (2008). Ba
- Page 189 and 190:
BIBLIOGRAPHIE 189Oudin, L., Andréa
- Page 191 and 192:
BIBLIOGRAPHIE 191Shamseldin, A., O
- Page 193 and 194:
tel-00392240, version 1 - 5 Jun 200
- Page 195 and 196:
Annexe ATable de correspondance ent
- Page 197 and 198:
Annexe A. Table de correspondance e
- Page 199 and 200:
Annexe BCaractéristiques et cartes
- Page 201 and 202:
Annexe B. Caractéristiques et cart
- Page 203 and 204:
Légende des cartes8 kmMaillage SAF
- Page 205 and 206:
Annexe B. Caractéristiques et cart
- Page 207 and 208:
Annexe B. Caractéristiques et cart
- Page 209 and 210:
Annexe B. Caractéristiques et cart
- Page 211 and 212:
Annexe B. Caractéristiques et cart
- Page 213 and 214:
Annexe B. Caractéristiques et cart
- Page 215 and 216:
Annexe B. Caractéristiques et cart
- Page 217 and 218:
Annexe B. Caractéristiques et cart
- Page 219 and 220:
Annexe B. Caractéristiques et cart
- Page 221 and 222:
Annexe B. Caractéristiques et cart
- Page 223 and 224:
Annexe B. Caractéristiques et cart
- Page 225 and 226:
Annexe B. Caractéristiques et cart
- Page 227 and 228:
Annexe B. Caractéristiques et cart
- Page 229 and 230:
Annexe B. Caractéristiques et cart
- Page 231 and 232:
Annexe B. Caractéristiques et cart
- Page 233 and 234:
Annexe B. Caractéristiques et cart
- Page 235 and 236:
Annexe B. Caractéristiques et cart
- Page 237 and 238:
Annexe B. Caractéristiques et cart
- Page 239 and 240:
Annexe B. Caractéristiques et cart
- Page 241 and 242:
Annexe B. Caractéristiques et cart
- Page 243 and 244:
Annexe B. Caractéristiques et cart
- Page 245 and 246:
Annexe B. Caractéristiques et cart
- Page 247 and 248:
Annexe B. Caractéristiques et cart
- Page 249 and 250:
Annexe B. Caractéristiques et cart
- Page 251 and 252:
Annexe B. Caractéristiques et cart
- Page 253 and 254:
Annexe CLes débits négatifs dans
- Page 255 and 256:
Annexe C. Les débits négatifs dan
- Page 257 and 258:
Annexe C. Les débits négatifs dan
- Page 259 and 260:
Annexe C. Les débits négatifs dan
- Page 261 and 262:
Annexe DApproximation de la courbe
- Page 263 and 264:
Annexe D. Approximation de la courb
- Page 265 and 266:
Annexe D. Approximation de la courb
- Page 267 and 268:
Annexe D. Approximation de la courb
- Page 269 and 270:
Annexe D. Approximation de la courb
- Page 271 and 272:
Annexe D. Approximation de la courb
- Page 273 and 274:
Annexe EAlgorithmique et codes C de
- Page 275 and 276:
Annexe E. Algorithmique et codes C
- Page 277 and 278:
Annexe E. Algorithmique et codes C
- Page 279 and 280:
Annexe E. Algorithmique et codes C
- Page 281 and 282:
Annexe E. Algorithmique et codes C
- Page 283 and 284:
Annexe E. Algorithmique et codes C
- Page 285 and 286:
Annexe E. Algorithmique et codes C
- Page 287 and 288:
Annexe E. Algorithmique et codes C
- Page 289 and 290:
Annexe E. Algorithmique et codes C
- Page 291 and 292:
Annexe Ftel-00392240, version 1 - 5
- Page 293 and 294:
Annexe F. Paramètres et critères
- Page 295 and 296:
Annexe F. Paramètres et critères
- Page 297 and 298:
Annexe GParamètres et critères de
- Page 299 and 300:
Annexe G. Paramètres et critères
- Page 301 and 302:
Annexe G. Paramètres et critères
- Page 303 and 304:
Annexe Htel-00392240, version 1 - 5
- Page 305 and 306:
Towards robust methods to couple lu
- Page 307 and 308:
5forecasting (Smith et al., 2009, t
- Page 309 and 310:
tion for a hydraulic model.These tw
- Page 311 and 312:
Apart from these few examples, the
- Page 313 and 314:
150nel (see Figure 1.d).All the dat
- Page 315 and 316:
tributed. Accordingly, the differen
- Page 317 and 318:
4.2 Lumped Rainfall-Runoff Model245
- Page 319 and 320: ∫ tO(t) = Ψ(t)+0with: Ψ(t) = L[
- Page 321 and 322: model. The main advantage of this p
- Page 323 and 324: that the robustness of the method c
- Page 325 and 326: 425no. 2, 7 and 11, see Table 1). O
- Page 327 and 328: performance between low (one tribut
- Page 329 and 330: 520circles and squares indicate the
- Page 331 and 332: combination of uniformly distribute
- Page 333 and 334: 620Das, T., Bárdossy, A., Zehe, E.
- Page 335 and 336: model for streamflow simulation. J.
- Page 337 and 338: (a) (b)Flint Creek nearKansasIllino
- Page 339 and 340: 1 tributary 2 tributariestel-003922
- Page 341 and 342: 1000(a) Tahlequah, Event no. 2Obs.1
- Page 343 and 344: EP, Peak Error (%)3530252015(a) Tah
- Page 345 and 346: (a) Option 1 (Point+Unif. Distr. In
- Page 347 and 348: Peak flowPeak flowEvent Nb. Start E
- Page 349 and 350: Annexe Itel-00392240, version 1 - 5
- Page 351 and 352: WATER RESOURCES RESEARCH, VOL. ???,
- Page 353 and 354: LERAT ET AL.: VALUE OF UPSTREAM FLO
- Page 355 and 356: LERAT ET AL.: VALUE OF UPSTREAM FLO
- Page 357 and 358: LERAT ET AL.: VALUE OF UPSTREAM FLO
- Page 359 and 360: LERAT ET AL.: VALUE OF UPSTREAM FLO
- Page 361 and 362: LERAT ET AL.: VALUE OF UPSTREAM FLO
- Page 363 and 364: LERAT ET AL.: VALUE OF UPSTREAM FLO
- Page 365 and 366: LERAT ET AL.: VALUE OF UPSTREAM FLO
- Page 367 and 368: LERAT ET AL.: VALUE OF UPSTREAM FLO
- Page 369: LERAT ET AL.: VALUE OF UPSTREAM FLO
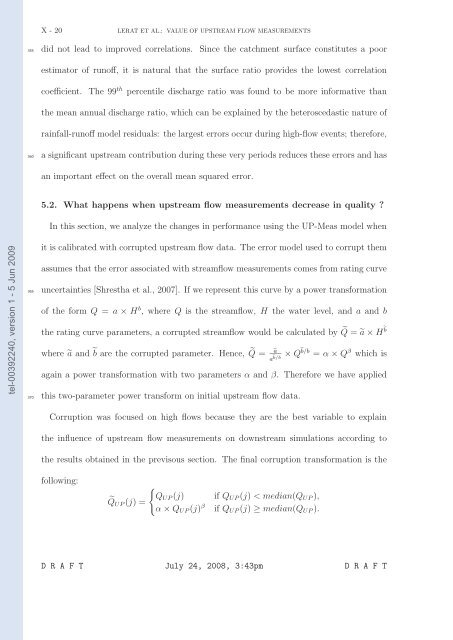
- Page 373 and 374: LERAT ET AL.: VALUE OF UPSTREAM FLO
- Page 375 and 376: LERAT ET AL.: VALUE OF UPSTREAM FLO
- Page 377 and 378: LERAT ET AL.: VALUE OF UPSTREAM FLO
- Page 379 and 380: LERAT ET AL.: VALUE OF UPSTREAM FLO
- Page 381 and 382: LERAT ET AL.: VALUE OF UPSTREAM FLO
- Page 383 and 384: LERAT ET AL.: VALUE OF UPSTREAM FLO
- Page 385 and 386: LERAT ET AL.: VALUE OF UPSTREAM FLO
- Page 387 and 388: LERAT ET AL.: VALUE OF UPSTREAM FLO
- Page 389 and 390: LERAT ET AL.: VALUE OF UPSTREAM FLO
- Page 391 and 392: tel-00392240, version 1 - 5 Jun 200


