- Page 4 and 5:
Edited by Peter J. Chen, Nicholas B
- Page 6 and 7:
Acknowledgments viii Introduction I
- Page 8 and 9:
Contents Religious communities and
- Page 12 and 13:
Nicholas Barry, John R. Butcher, Pe
- Page 14 and 15:
Introduction The study of politics
- Page 16 and 17:
Introduction nature tends towards i
- Page 18 and 19:
Introduction existence represented
- Page 20 and 21:
Introduction it reflects the knowle
- Page 22 and 23:
Introduction Section Political soci
- Page 24 and 25:
Introduction Meagher, Gabrielle, an
- Page 26 and 27:
Introduction research covers policy
- Page 28 and 29:
A short political history of Austra
- Page 30 and 31:
A short political history of Austra
- Page 32 and 33:
A short political history of Austra
- Page 34 and 35:
A short political history of Austra
- Page 36 and 37:
A short political history of Austra
- Page 38 and 39:
A short political history of Austra
- Page 40 and 41:
A short political history of Austra
- Page 42 and 43:
Australian political thought Loveda
- Page 44 and 45:
Australian political thought Anothe
- Page 46 and 47:
Australian political thought in suc
- Page 48 and 49:
Australian political thought linked
- Page 50 and 51:
Australian political thought giving
- Page 52 and 53:
Australian political thought andthe
- Page 54 and 55:
Australian political thought commit
- Page 56 and 57:
Australian political thought The do
- Page 58 and 59:
Australian political thought ——
- Page 62 and 63:
Marija Taflaga Key terms/names acco
- Page 64 and 65:
Executive government This distingui
- Page 66 and 67:
Executive government When the Austr
- Page 68 and 69:
Executive government Since the late
- Page 70 and 71:
Executive government Table 1 Cabine
- Page 72 and 73:
Executive government • the overal
- Page 74 and 75:
Executive government served its opp
- Page 76 and 77:
Executive government Figure 1 The m
- Page 78 and 79:
Executive government Shergold, Pete
- Page 80 and 81:
Parliaments of Australia role, many
- Page 82 and 83:
Parliaments of Australia Table 1 Pa
- Page 84 and 85:
Parliaments of Australia Parliament
- Page 86 and 87:
Parliaments of Australia Case examp
- Page 88 and 89: Parliaments of Australia Immediatel
- Page 90 and 91: Parliaments of Australia Case examp
- Page 92 and 93: Parliaments of Australia Scrutiny o
- Page 94 and 95: Parliaments of Australia summary, f
- Page 96 and 97: Jill Sheppard Key terms/names compu
- Page 98 and 99: Electoral systems Figure 1 Response
- Page 100 and 101: Electoral systems However, individu
- Page 102 and 103: Electoral systems linedupandfilledi
- Page 104 and 105: Electoral systems Figure 2 Australi
- Page 106 and 107: Electoral systems government’s fo
- Page 108 and 109: Electoral systems to be grouped wit
- Page 110 and 111: Electoral systems Figure 3 Sample b
- Page 112 and 113: Electoral systems Figure 5 Sample b
- Page 114 and 115: Electoral systems About the author
- Page 116 and 117: The Australian party system Party s
- Page 118 and 119: The Australian party system The sec
- Page 120 and 121: The Australian party system respons
- Page 122 and 123: The Australian party system to vote
- Page 124 and 125: The Australian party system Like th
- Page 126 and 127: The Australian party system per cen
- Page 128 and 129: The Australian party system party s
- Page 130 and 131: The Australian party system splits
- Page 132 and 133: The Australian party system Macridi
- Page 134 and 135: The public sector The contemporary
- Page 136 and 137: The public sector back to the 1854
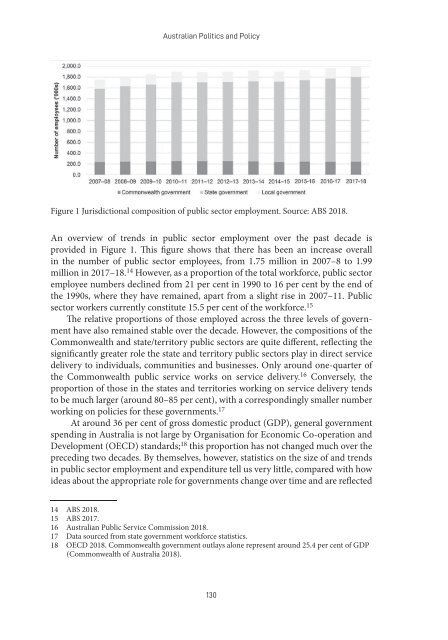
- Page 140 and 141: The public sector in the public sec
- Page 142 and 143: The public sector Table 1 Compariso
- Page 144 and 145: The public sector Figure 2 Public s
- Page 146 and 147: The public sector whole-of-client s
- Page 148 and 149: The public sector • How should th
- Page 150 and 151: The public sector Parker, R. (1978)
- Page 152 and 153: Mary Griffiths Key terms/names Aust
- Page 154 and 155: Media and democracy Mediatisation T
- Page 156 and 157: Media and democracy into ever narro
- Page 158 and 159: Media and democracy majority of Aus
- Page 160 and 161: Media and democracy consumers is pr
- Page 162 and 163: Media and democracy programming, yo
- Page 164 and 165: Media and democracy Limits of press
- Page 166 and 167: Media and democracy Parliament Hous
- Page 168 and 169: Media and democracy Journalists vig
- Page 170 and 171: Media and democracy ofreplyonasocia
- Page 172 and 173: Grant Hooper Key terms/names appeal
- Page 174 and 175: Courts Suchrightsarefoundinthecommo
- Page 176 and 177: Courts It was clear that the High C
- Page 178 and 179: Courts Figure 1 Generalised Austral
- Page 180 and 181: Courts Figure 3 Generalised NSW cri
- Page 182 and 183: Courts While the rule of law is a c
- Page 184 and 185: Courts or opinions upon policy. We
- Page 186 and 187: Courts jurisprudence, it chose to v
- Page 188 and 189:
Courts Perhapsmostcontroversially,a
- Page 190:
Courts Harvey, Callie (2017). Found
- Page 195 and 196:
Australian Politics and Policy ment
- Page 197 and 198:
Australian Politics and Policy In s
- Page 199 and 200:
Australian Politics and Policy the
- Page 201 and 202:
Australian Politics and Policy stat
- Page 203 and 204:
Australian Politics and Policy The
- Page 205 and 206:
Australian Politics and Policy terr
- Page 207 and 208:
Australian Politics and Policy and
- Page 209 and 210:
Australian Politics and Policy Comm
- Page 211 and 212:
Robin Tennant-Wood Key terms/names
- Page 213 and 214:
Australian Politics and Policy Tabl
- Page 215 and 216:
Australian Politics and Policy The
- Page 217 and 218:
Australian Politics and Policy Cons
- Page 219 and 220:
Australian Politics and Policy forg
- Page 221 and 222:
David Clune and Rodney Smith Key te
- Page 223 and 224:
Australian Politics and Policy repr
- Page 225 and 226:
Australian Politics and Policy sinc
- Page 227 and 228:
Australian Politics and Policy 1900
- Page 229 and 230:
Australian Politics and Policy Elec
- Page 231 and 232:
Australian Politics and Policy Tabl
- Page 233 and 234:
Australian Politics and Policy Tabl
- Page 235 and 236:
Australian Politics and Policy offi
- Page 237 and 238:
Australian Politics and Policy Tabl
- Page 239 and 240:
Australian Politics and Policy Clif
- Page 241 and 242:
Australian Politics and Policy Rodn
- Page 243 and 244:
Australian Politics and Policy fede
- Page 245 and 246:
Australian Politics and Policy This
- Page 247 and 248:
Australian Politics and Policy The
- Page 249 and 250:
Australian Politics and Policy Land
- Page 251 and 252:
Australian Politics and Policy conv
- Page 253 and 254:
Australian Politics and Policy Prod
- Page 255 and 256:
Australian Politics and Policy Aust
- Page 257 and 258:
Australian Politics and Policy Tabl
- Page 259 and 260:
Australian Politics and Policy This
- Page 261 and 262:
Australian Politics and Policy such
- Page 263 and 264:
Australian Politics and Policy bala
- Page 265 and 266:
Australian Politics and Policy Quee
- Page 267 and 268:
Australian Politics and Policy Prem
- Page 269 and 270:
Australian Politics and Policy (CPV
- Page 271 and 272:
Australian Politics and Policy Refe
- Page 273 and 274:
Australian Politics and Policy —
- Page 275 and 276:
Australian Politics and Policy Yet,
- Page 277 and 278:
Australian Politics and Policy Thir
- Page 279 and 280:
Australian Politics and Policy Figu
- Page 281 and 282:
Australian Politics and Policy The
- Page 283 and 284:
Australian Politics and Policy Figu
- Page 285 and 286:
Australian Politics and Policy Soci
- Page 287 and 288:
Australian Politics and Policy Seve
- Page 289 and 290:
Australian Politics and Policy Parl
- Page 291 and 292:
Australian Politics and Policy many
- Page 293 and 294:
Australian Politics and Policy Legi
- Page 295 and 296:
Australian Politics and Policy Then
- Page 297 and 298:
Australian Politics and Policy In T
- Page 299 and 300:
Australian Politics and Policy Coun
- Page 301 and 302:
Australian Politics and Policy Faul
- Page 303 and 304:
Australian Politics and Policy Hodg
- Page 305 and 306:
Nick Economou Key terms/names const
- Page 307 and 308:
Australian Politics and Policy Hist
- Page 309 and 310:
Australian Politics and Policy Tabl
- Page 311 and 312:
Australian Politics and Policy part
- Page 313 and 314:
Australian Politics and Policy Tabl
- Page 315 and 316:
Australian Politics and Policy Elec
- Page 317 and 318:
Australian Politics and Policy The
- Page 319 and 320:
Australian Politics and Policy was
- Page 321 and 322:
Australian Politics and Policy most
- Page 323 and 324:
Narelle Miragliotta, Sarah Murray a
- Page 325 and 326:
Australian Politics and Policy Fede
- Page 327 and 328:
Australian Politics and Policy Howe
- Page 329 and 330:
Australian Politics and Policy reco
- Page 331 and 332:
Australian Politics and Policy diff
- Page 333 and 334:
Australian Politics and Policy ofth
- Page 335 and 336:
Australian Politics and Policy Betw
- Page 337 and 338:
Australian Politics and Policy Refe
- Page 339 and 340:
Australian Politics and Policy Abou
- Page 341 and 342:
Australian Politics and Policy Fina
- Page 343 and 344:
Australian Politics and Policy in e
- Page 345 and 346:
Australian Politics and Policy in o
- Page 347 and 348:
Australian Politics and Policy Tabl
- Page 349 and 350:
Australian Politics and Policy Majo
- Page 351 and 352:
Australian Politics and Policy impo
- Page 353 and 354:
Australian Politics and Policy gove
- Page 355 and 356:
Australian Politics and Policy For
- Page 357 and 358:
Australian Politics and Policy Lamo
- Page 359:
Australian Politics and Policy Envi
- Page 363 and 364:
Australian Politics and Policy conf
- Page 365 and 366:
Australian Politics and Policy The
- Page 367 and 368:
Australian Politics and Policy Indi
- Page 369 and 370:
Australian Politics and Policy migh
- Page 371 and 372:
Australian Politics and Policy give
- Page 373 and 374:
Australian Politics and Policy Hous
- Page 375 and 376:
Australian Politics and Policy have
- Page 377 and 378:
Australian Politics and Policy Whil
- Page 379 and 380:
Australian Politics and Policy Jabo
- Page 381 and 382:
Australian Politics and Policy —
- Page 383 and 384:
Australian Politics and Policy impa
- Page 385 and 386:
Australian Politics and Policy proc
- Page 387 and 388:
Australian Politics and Policy indu
- Page 389 and 390:
Australian Politics and Policy Unde
- Page 391 and 392:
Australian Politics and Policy (not
- Page 393 and 394:
Australian Politics and Policy gove
- Page 395 and 396:
Australian Politics and Policy tran
- Page 397 and 398:
Australian Politics and Policy Gilf
- Page 399 and 400:
Diana Perche and Jason O’Neil Key
- Page 401 and 402:
Australian Politics and Policy Indi
- Page 403 and 404:
Australian Politics and Policy maki
- Page 405 and 406:
Australian Politics and Policy was
- Page 407 and 408:
Australian Politics and Policy can
- Page 409 and 410:
Australian Politics and Policy Foll
- Page 411 and 412:
Australian Politics and Policy Sull
- Page 413 and 414:
Australian Politics and Policy One
- Page 415 and 416:
Australian Politics and Policy alte
- Page 417 and 418:
Australian Politics and Policy Firs
- Page 419 and 420:
Australian Politics and Policy Gobb
- Page 421 and 422:
Juliet Pietsch Key terms/names assi
- Page 423 and 424:
Australian Politics and Policy over
- Page 425 and 426:
Australian Politics and Policy sugg
- Page 427 and 428:
Australian Politics and Policy The
- Page 429 and 430:
Australian Politics and Policy area
- Page 431 and 432:
Australian Politics and Policy up t
- Page 433 and 434:
Australian Politics and Policy Tabl
- Page 435 and 436:
Australian Politics and Policy Refe
- Page 437 and 438:
Australian Politics and Policy Abou
- Page 439 and 440:
Australian Politics and Policy What
- Page 441 and 442:
Australian Politics and Policy must
- Page 443 and 444:
Australian Politics and Policy iden
- Page 445 and 446:
Australian Politics and Policy •
- Page 447 and 448:
Australian Politics and Policy ofte
- Page 449 and 450:
Australian Politics and Policy Alth
- Page 451 and 452:
Australian Politics and Policy In f
- Page 453 and 454:
Australian Politics and Policy Aust
- Page 455 and 456:
Australian Politics and Policy bure
- Page 457 and 458:
Australian Politics and Policy of f
- Page 459 and 460:
Australian Politics and Policy Rich
- Page 461 and 462:
Marion Maddox and Rodney Smith Key
- Page 463 and 464:
Australian Politics and Policy Will
- Page 465 and 466:
Australian Politics and Policy has
- Page 467 and 468:
Australian Politics and Policy Tabl
- Page 469 and 470:
Australian Politics and Policy Thes
- Page 471 and 472:
Australian Politics and Policy Reli
- Page 473 and 474:
Australian Politics and Policy and
- Page 475 and 476:
Australian Politics and Policy dire
- Page 477 and 478:
Australian Politics and Policy Osli
- Page 479 and 480:
Shaun Ratcliff Key terms/names agen
- Page 481 and 482:
Australian Politics and Policy The
- Page 483 and 484:
Australian Politics and Policy to b
- Page 485 and 486:
Australian Politics and Policy surv
- Page 487 and 488:
Australian Politics and Policy pres
- Page 489 and 490:
Australian Politics and Policy thin
- Page 491 and 492:
Australian Politics and Policy The
- Page 493 and 494:
Australian Politics and Policy Refe
- Page 495 and 496:
Australian Politics and Policy and
- Page 497 and 498:
Australian Politics and Policy part
- Page 499 and 500:
Australian Politics and Policy scho
- Page 501 and 502:
Australian Politics and Policy brai
- Page 503 and 504:
Australian Politics and Policy Rath
- Page 505 and 506:
Australian Politics and Policy For
- Page 507 and 508:
Australian Politics and Policy way
- Page 509:
Australian Politics and Policy Stan
- Page 513 and 514:
Australian Politics and Policy the
- Page 515 and 516:
Australian Politics and Policy For
- Page 517 and 518:
Australian Politics and Policy cont
- Page 519 and 520:
Australian Politics and Policy requ
- Page 521 and 522:
Australian Politics and Policy The
- Page 523 and 524:
Australian Politics and Policy (one
- Page 525 and 526:
Australian Politics and Policy 3. g
- Page 527 and 528:
Australian Politics and Policy Impl
- Page 529 and 530:
Australian Politics and Policy Haye
- Page 531 and 532:
Jock Given Key terms/names Australi
- Page 533 and 534:
Australian Politics and Policy (ICT
- Page 535 and 536:
Australian Politics and Policy Fair
- Page 537 and 538:
Australian Politics and Policy indu
- Page 539 and 540:
Australian Politics and Policy Laws
- Page 541 and 542:
Australian Politics and Policy thea
- Page 543 and 544:
Australian Politics and Policy comm
- Page 545 and 546:
Australian Politics and Policy infr
- Page 547 and 548:
Australian Politics and Policy chan
- Page 549 and 550:
Australian Politics and Policy Toor
- Page 551 and 552:
Australian Politics and Policy •
- Page 553 and 554:
Australian Politics and Policy impl
- Page 555 and 556:
Australian Politics and Policy Econ
- Page 557 and 558:
Australian Politics and Policy thre
- Page 559 and 560:
Australian Politics and Policy Micr
- Page 561 and 562:
Australian Politics and Policy The
- Page 563 and 564:
Australian Politics and Policy And
- Page 565 and 566:
Australian Politics and Policy Fenn
- Page 567 and 568:
Australian Politics and Policy Abou
- Page 569 and 570:
Australian Politics and Policy does
- Page 571 and 572:
Australian Politics and Policy Dove
- Page 573 and 574:
Australian Politics and Policy harm
- Page 575 and 576:
Australian Politics and Policy Tabl
- Page 577 and 578:
Australian Politics and Policy the
- Page 579 and 580:
Australian Politics and Policy busi
- Page 581 and 582:
Australian Politics and Policy Type
- Page 583 and 584:
Australian Politics and Policy Anot
- Page 585 and 586:
Australian Politics and Policy the
- Page 587 and 588:
Australian Politics and Policy Hasl
- Page 589 and 590:
Thomas S. Wilkins and Nicholas Brom
- Page 591 and 592:
Australian Politics and Policy whic
- Page 593 and 594:
Australian Politics and Policy Aust
- Page 595 and 596:
Australian Politics and Policy comm
- Page 597 and 598:
Australian Politics and Policy infl
- Page 599 and 600:
Australian Politics and Policy argu
- Page 601 and 602:
Australian Politics and Policy to t
- Page 603 and 604:
Australian Politics and Policy 2012
- Page 605 and 606:
Australian Politics and Policy infl
- Page 607 and 608:
Australian Politics and Policy atta
- Page 609 and 610:
Australian Politics and Policy Curt
- Page 611 and 612:
Australian Politics and Policy Stok
- Page 613 and 614:
Australian Politics and Policy whic
- Page 615 and 616:
Australian Politics and Policy Aust
- Page 617 and 618:
Australian Politics and Policy wasn
- Page 619 and 620:
Australian Politics and Policy But
- Page 621 and 622:
Australian Politics and Policy phar
- Page 623 and 624:
Australian Politics and Policy incl
- Page 625 and 626:
Australian Politics and Policy Thes
- Page 627 and 628:
Australian Politics and Policy reve
- Page 629 and 630:
Australian Politics and Policy prom
- Page 631 and 632:
Australian Politics and Policy Baum
- Page 633 and 634:
Andrew Parkin and Leonie Hardcastle
- Page 635 and 636:
Australian Politics and Policy or e
- Page 637 and 638:
Australian Politics and Policy An i
- Page 639 and 640:
Australian Politics and Policy In t
- Page 641 and 642:
Australian Politics and Policy Figu
- Page 643 and 644:
Australian Politics and Policy Tabl
- Page 645 and 646:
Australian Politics and Policy Figu
- Page 647 and 648:
Australian Politics and Policy Ther
- Page 649 and 650:
Australian Politics and Policy An i
- Page 651 and 652:
Australian Politics and Policy towa
- Page 653 and 654:
Australian Politics and Policy —
- Page 655 and 656:
Australian Politics and Policy Unit
- Page 657 and 658:
Australian Politics and Policy appr
- Page 659 and 660:
Australian Politics and Policy •
- Page 661 and 662:
Australian Politics and Policy The
- Page 663 and 664:
Australian Politics and Policy More
- Page 665 and 666:
Australian Politics and Policy Many
- Page 667 and 668:
Australian Politics and Policy appe
- Page 669 and 670:
Australian Politics and Policy resp
- Page 671 and 672:
Australian Politics and Policy Mode
- Page 673 and 674:
Australian Politics and Policy Tabl
- Page 675 and 676:
Australian Politics and Policy The
- Page 677 and 678:
Australian Politics and Policy just
- Page 679 and 680:
Australian Politics and Policy regi
- Page 681 and 682:
Australian Politics and Policy •
- Page 683 and 684:
Australian Politics and Policy and
- Page 685 and 686:
Australian Politics and Policy gove
- Page 687 and 688:
Australian Politics and Policy Regi
- Page 689 and 690:
Australian Politics and Policy Quee
- Page 691 and 692:
Australian Politics and Policy poli
- Page 693 and 694:
Australian Politics and Policy amou
- Page 695 and 696:
Australian Politics and Policy Daly
- Page 697 and 698:
Greg Marston and Zoe Staines Key te
- Page 699 and 700:
Australian Politics and Policy by t
- Page 701 and 702:
Australian Politics and Policy circ
- Page 703 and 704:
Australian Politics and Policy ‘e
- Page 705 and 706:
Australian Politics and Policy deli
- Page 707 and 708:
Australian Politics and Policy of p
- Page 709 and 710:
Australian Politics and Policy At t
- Page 711 and 712:
Australian Politics and Policy Alte
- Page 713 and 714:
Australian Politics and Policy Refe
- Page 715 and 716:
Australian Politics and Policy Nevo
- Page 717 and 718:
Madeleine Pill and Dallas Rogers Ke
- Page 719 and 720:
Australian Politics and Policy glob
- Page 721 and 722:
Australian Politics and Policy proc
- Page 723 and 724:
Australian Politics and Policy boos
- Page 725 and 726:
Australian Politics and Policy Alth
- Page 727 and 728:
Australian Politics and Policy from
- Page 729 and 730:
Australian Politics and Policy Here
- Page 731 and 732:
Australian Politics and Policy Edwa
- Page 733 and 734:
Susan Ressia, Shalene Werth and Dav
- Page 735 and 736:
Australian Politics and Policy thel
- Page 737 and 738:
Figure 1 Union density. Source: ABS
- Page 739 and 740:
Australian Politics and Policy prod
- Page 741 and 742:
Australian Politics and Policy Afte
- Page 743 and 744:
Australian Politics and Policy move
- Page 745 and 746:
Australian Politics and Policy Smal
- Page 747 and 748:
Australian Politics and Policy Work
- Page 749 and 750:
Figure 2 Working days lost per 1000
- Page 751 and 752:
Australian Politics and Policy Fors
- Page 753:
Australian Politics and Policy Davi