- Page 1 and 2: Miljø- og Energiministeriet Danmar
- Page 3 and 4: Miljø- og Energiministeriet Danmar
- Page 5 and 6: Indhold Forord 7 Sammenfatning 8 Su
- Page 7 and 8: 7 Energiforbrug og emissioner 176 7
- Page 9 and 10: Sammenfatning Denne rapport beskriv
- Page 11 and 12: taktivitet (Vejdirektoratet, 1999).
- Page 13 and 14: 100% 90% 80% 70% 60% 50% 40% 30% 20
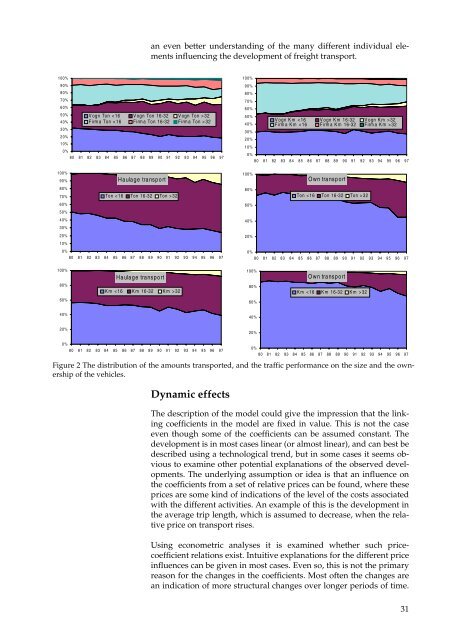
- Page 15 and 16: Selvom der i de fleste tilfælde ka
- Page 17 and 18: 1000 Ton 250000 200000 150000 10000
- Page 19 and 20: dere er de transporterede mængder
- Page 21 and 22: 2 1,8 1,6 1,4 1,2 1 0,8 0,6 0,4 0,2
- Page 23 and 24: et passende udgangsniveau (f.eks. n
- Page 25 and 26: til produktion i den kemiske indust
- Page 27 and 28: Summary This report describes the r
- Page 29 and 30: several goods. That model has been
- Page 31: numbers are provided from which it
- Page 35 and 36: stability of the regression results
- Page 37 and 38: The reason for choosing between imp
- Page 39 and 40: 38 100% 90% 80% 70% 60% 50% 40% 30%
- Page 41 and 42: describe any actual alternative to
- Page 43 and 44: large, because the value of the agg
- Page 45 and 46: skelle ved de to metodiske tilgange
- Page 47 and 48: Selvom fordelingen på transportmid
- Page 49 and 50: ikke formålet med modellen at anal
- Page 51 and 52: Transportmængderne i de ti transpo
- Page 53 and 54: I Figur 1-2 er den generelle strukt
- Page 55 and 56: udregnes én samlet handlefaktor fo
- Page 57 and 58: I sammenligning med McKinnon og Woo
- Page 59 and 60: de anvendes til varetransport, da d
- Page 61 and 62: emissionskomponent. Beskrivelsen af
- Page 63 and 64: 80000 70000 60000 50000 40000 30000
- Page 65 and 66: 3 2,5 2 1,5 1 0,5 0 2 Korn 10 kul o
- Page 67 and 68: Ton 230000 220000 210000 200000 190
- Page 69 and 70: 100% 90% 80% 70% 60% 50% Vogn Ton 3
- Page 71 and 72: Ton 25 20 15 10 5 0 Ton 25 20 15 10
- Page 73 and 74: ug både i transporterhvervene, i b
- Page 75 and 76: 3 Omregning af produktionsværdier
- Page 77 and 78: Færdigvare- Tabel 3-2 Input i vare
- Page 79 and 80: De beregnede andele for 1990 er vis
- Page 81 and 82: Det er et betydeligt reduceret anta
- Page 83 and 84:
Som statistisk teststørrelse er an
- Page 85 and 86:
0,08 0,07 0,06 0,05 0,04 0,03 0,02
- Page 87 and 88:
Det er ikke muligt at anvende den s
- Page 89 and 90:
og produktion i kr. Et andet eksemp
- Page 91 and 92:
Tabel 3-8 Resultaterne fra den dire
- Page 93 and 94:
eskrive udviklingen. Dette er ikke
- Page 95 and 96:
4 Handlefaktor og transporterede to
- Page 97 and 98:
Inddeling af varegrupperne i tre ho
- Page 99 and 100:
4.1.4 Estimation Hvad forklarer udv
- Page 101 and 102:
4.1.5 Trenden som forklarende varia
- Page 103 and 104:
Tabel 4-2 Signifikansniveauer og pa
- Page 105 and 106:
alet. Dette vil føre til ekstra tr
- Page 107 and 108:
der er meget små. Noget tyder på,
- Page 109 and 110:
fattes som prisen på en fast beste
- Page 111 and 112:
gerne ved produktion i forhold til
- Page 113 and 114:
Estimation af en model formuleret v
- Page 115 and 116:
denne metode indføres en vis syste
- Page 117 and 118:
mationer om de enkelte sektorer, og
- Page 119 and 120:
Grunden til den meget varierende v
- Page 121 and 122:
100% 90% 80% 70% 60% 50% 40% 30% 20
- Page 123 and 124:
Selvom der kan argumenteres for, at
- Page 125 and 126:
4.2.3 Vurdering af fordeling på mo
- Page 127 and 128:
snitlige trafikarbejde mellem de en
- Page 129 and 130:
men i de fleste varekategorier er d
- Page 131 and 132:
For at undersøge, om der kan estim
- Page 133 and 134:
der endvidere heller ikke er sammen
- Page 135 and 136:
90’erne sammenlignet med lavkonju
- Page 137 and 138:
Varebilerne anvendes til privatkør
- Page 139 and 140:
4000 3500 3000 2500 2000 1500 1000
- Page 141 and 142:
pX 1,20 1,00 0,80 0,60 0,40 0,20 0,
- Page 143 and 144:
plader” til privat kørsel. Denne
- Page 145 and 146:
lavere Km/Kr forhold og dermed til
- Page 147 and 148:
Ingen af disse trendmodeller opnår
- Page 149 and 150:
0,14 0,12 0,1 0,08 0,06 0,04 0,02 0
- Page 151 and 152:
Vi vil derfor konkludere, at den op
- Page 153 and 154:
6 Transport til udlandet I dette ka
- Page 155 and 156:
For hver enkelt transport angives h
- Page 157 and 158:
Ved opdeling på de enkelte varegru
- Page 159 and 160:
6.3 Modelopstilling Opstillingen af
- Page 161 and 162:
egnskabet. Forskellen målt i aggre
- Page 163 and 164:
Tabel 6-3 Estimationsresultater af
- Page 165 and 166:
ter (gruppe 12) og Gødningsstoffer
- Page 167 and 168:
Mio. tons Mio. tons Mio. tons Mio.
- Page 169 and 170:
også varegrupperne 8, 15, 20 og 22
- Page 171 and 172:
Tabel 6-6 Estimation af import vær
- Page 173 and 174:
hu_jl 0,4 0,35 0,3 0,25 0,2 0,15 0,
- Page 175 and 176:
importprisen på den enkelte varegr
- Page 177 and 178:
7 Energiforbrug og emissioner Energ
- Page 179 and 180:
178 e * vkm l, a, t l, a, 1997 a l,
- Page 181 and 182:
tilfælde meget nuanceret billede a
- Page 183 and 184:
I Finansministeriet (2000) angives
- Page 185 and 186:
Tabel 8-2 Nøgletal for fremskrivni
- Page 187 and 188:
8.2.3 Miljømæssige konsekvenser S
- Page 189 and 190:
F.eks. er der kraftige reduktioner
- Page 191 and 192:
1,8 1,6 1,4 1,2 1 0,8 0,6 0,4 0,2 0
- Page 193 and 194:
Tabel 8-5 Nøgletal (indekseret) fo
- Page 195 and 196:
1800000 1600000 1400000 1200000 100
- Page 197 and 198:
8.3.2 Sammenligning med EMMA Sammen
- Page 199 and 200:
som det her anvendte kan Vejdirekto
- Page 201 and 202:
En sammenligning af ændringerne ge
- Page 203 and 204:
Tabel 8-7 Indekserede ændringer (b
- Page 205 and 206:
204 0 -5000 -10000 -15000 -20000 -2
- Page 207 and 208:
9 Litteratur Andersen. F.M. og Trie
- Page 209 and 210:
Ohm, A. og Bøgelund, M. (1995) Sub
- Page 211 and 212:
{ Oversigt over varekategorier i k
- Page 213 and 214:
Side 2 212
- Page 215 and 216:
30000 25000 20000 15000 10000 5000
- Page 217 and 218:
7 8 9 10 11 1000 Ton 35000 30000 25
- Page 219 and 220:
17 18 19 20 21 1000 Ton 20000 18000
- Page 221 and 222:
0,5 0,45 0,4 0,35 0,3 0,25 0,2 0,15
- Page 223 and 224:
Bilag E Estimationsprocedurer - teo
- Page 225 and 226:
afhængige variabel er at de begge
- Page 227 and 228:
λ ⎧ ~ Y −1 ⎪ = når λ ≠ 0
- Page 229 and 230:
trend): Yt = α 0 + δ 0t + λX t +
- Page 231 and 232:
1000 Ton 3500 3000 2500 2000 1500 1
- Page 233 and 234:
Bilag G Gruppering af varegrupper I
- Page 235 and 236:
234 Varegruppe Eksport Import 5 0 5
- Page 237 and 238:
236 Varegruppe Eksport Import 16 0
- Page 239 and 240:
238 Varegruppe Eksport Import 26 0
- Page 241 and 242:
hu_jl 0,09 0,08 0,07 0,06 0,05 0,04
- Page 243 and 244:
hu_jl 0,09 0,08 0,07 0,06 0,05 0,04
- Page 245 and 246:
Firmabiler under 16 tons Firmabiler
- Page 247 and 248:
Firmabiler under 16 tons Firmabiler
- Page 249 and 250:
Danmarks Miljøundersøgelser Danma
- Page 251:
Rapporten beskriver analyser og udv