- Page 1 and 2:
FY 2007 - 2008 defence Department:
- Page 3 and 4:
defence Department: Defence REPUBLI
- Page 5 and 6:
| Department of Defence | CHAPTER 2
- Page 7 and 8:
| Department of Defence | CHAPTER 7
- Page 9 and 10:
| Department of Defence | CHAPTER 2
- Page 11 and 12:
| Department of Defence | CHAPTER 1
- Page 13 and 14:
| Department of Defence | Foreword
- Page 15 and 16:
| Department of Defence | Strategic
- Page 17 and 18:
operational once the maritime helic
- Page 19 and 20:
| Department of Defence | Table 1.2
- Page 21 and 22:
| Department of Defence | Part 1: S
- Page 23 and 24:
Management Information Systems) are
- Page 25 and 26:
The Services and Divisions are comp
- Page 27 and 28:
• “One Force” and “Core For
- Page 29 and 30:
DEFENCE OUTPUTS | Department of Def
- Page 31 and 32:
| Department of Defence | Once the
- Page 33 and 34:
REASONS FOR ADDITIONS TO, OR VIREME
- Page 35 and 36:
TRANSFER PAYMENTS FOR FY 2007/08 |
- Page 37 and 38:
In order to ensure that there are c
- Page 39 and 40:
operations has far exceeded the ori
- Page 41 and 42:
INTRODUCTION | Department of Defenc
- Page 43 and 44:
SUBPROGRAMME DEPARTMENTAL DIRECTION
- Page 45 and 46:
• • • The ability to appropri
- Page 47 and 48:
| Department of Defence | Table 2.3
- Page 49 and 50:
| Department of Defence | Table 2.4
- Page 51 and 52:
| Department of Defence | Table 2.5
- Page 53 and 54:
| Department of Defence | Table 2.5
- Page 55 and 56:
| Department of Defence | Table 2.5
- Page 57 and 58:
| Department of Defence | Table 2.5
- Page 59 and 60:
| Department of Defence | Table 2.5
- Page 61 and 62:
• • of the SANDF (C SANDF) must
- Page 63 and 64:
| Department of Defence | Table 2.7
- Page 65 and 66:
| Department of Defence | Table 2.8
- Page 67 and 68:
led defence industry-heavy delegati
- Page 69 and 70:
project and the Hawk trainer aircra
- Page 71 and 72:
| Department of Defence | Table 2.1
- Page 73 and 74:
Procurement Services | Department o
- Page 75 and 76:
Defence-Related Industry in facilit
- Page 77 and 78:
May 2005); Mr D.S. Molapo (27 May 2
- Page 79 and 80:
Performance and Service Delivery Im
- Page 81 and 82:
Defence legal service capability an
- Page 83 and 84:
for the management of a number of d
- Page 85 and 86:
• During the reporting period, th
- Page 87 and 88:
| Department of Defence | Table 2.1
- Page 89 and 90:
| Department of Defence | Table 2.1
- Page 91 and 92:
| Department of Defence | Table 2.2
- Page 93 and 94:
| Department of Defence | Table 2.2
- Page 95 and 96:
• • • The challenge in establ
- Page 97 and 98:
SUBPROGRAMME RELIGIOUS SERVICES DIV
- Page 99 and 100:
and functions in achieving the DOD
- Page 101 and 102:
Activities Planned Management Inter
- Page 103 and 104:
| Department of Defence | Table 2.3
- Page 105 and 106:
has been drawn up between the DOD,
- Page 107 and 108:
Outputs | Department of Defence | D
- Page 109 and 110:
Overview | Department of Defence |
- Page 111 and 112:
Operations Development Capability |
- Page 113 and 114:
| Department of Defence | Table 3.1
- Page 115 and 116:
| Department of Defence | Table 3.1
- Page 117 and 118:
Operation HUMAN Support to Governme
- Page 119 and 120:
| Department of Defence | Table 3.2
- Page 121 and 122:
| Department of Defence | Table 3.6
- Page 123 and 124:
Overview | Department of Defence |
- Page 125 and 126:
Although FY 2007/08 presented the S
- Page 127 and 128:
| Department of Defence | Table 4.1
- Page 129 and 130:
| Department of Defence | Table 4.1
- Page 131 and 132:
| Department of Defence | Table 4.1
- Page 133 and 134:
Policy Option Military Skills Devel
- Page 135 and 136:
Activities Control system to confir
- Page 137 and 138:
Overview During the past year, the
- Page 139 and 140:
• • • Base support capability
- Page 141 and 142:
| Department of Defence | Table 5.1
- Page 143 and 144:
| Department of Defence | Table 5.1
- Page 145 and 146:
| Department of Defence | Table 5.1
- Page 147 and 148:
| Department of Defence | Table 5.1
- Page 149 and 150:
| Department of Defence | Table 5.1
- Page 151 and 152:
| Department of Defence | Table 5.3
- Page 153 and 154:
Policy Developments The amendment t
- Page 155 and 156:
Overview | Department of Defence |
- Page 157 and 158:
Measurable Objective | Department o
- Page 159 and 160:
Planned Exercises | Department of D
- Page 161 and 162:
Activities Planned Management Inter
- Page 163 and 164:
Overview | Department of Defence |
- Page 165 and 166:
| Department of Defence | Table 7.1
- Page 167 and 168:
| Department of Defence | Table 7.1
- Page 169 and 170:
| Department of Defence | Table 7.1
- Page 171 and 172:
| Department of Defence | Table 7.3
- Page 173 and 174:
| Department of Defence | Table 7.4
- Page 175 and 176:
Overview | Department of Defence |
- Page 177 and 178:
Outputs | Department of Defence | D
- Page 179 and 180:
| Department of Defence | Defence I
- Page 181 and 182:
SUBPROGRAMME JOINT LOGISTICS SERVIC
- Page 183 and 184:
One of the major challenges that th
- Page 185 and 186:
| Department of Defence | Table 9.1
- Page 187 and 188:
SUBPROGRAMME COMMAND AND MANAGEMENT
- Page 189 and 190:
| Department of Defence | Table 9.3
- Page 191 and 192:
Outputs | Department of Defence | D
- Page 193 and 194:
| Department of Defence | Table 9.6
- Page 195 and 196:
Division will transfer the know-how
- Page 197 and 198:
Overview | Department of Defence |
- Page 199 and 200:
Service Delivery Improvement Plan |
- Page 201 and 202:
| Department of Defence | Table 10.
- Page 203 and 204:
| Department of Defence | Table 10.
- Page 205 and 206:
| Department of Defence | Table 10.
- Page 207 and 208:
| Department of Defence | Table 10.
- Page 209 and 210:
| Department of Defence | Table 10.
- Page 211 and 212:
Foreign Workers | Department of Def
- Page 213 and 214:
| Department of Defence | Table 10.
- Page 215 and 216:
| Department of Defence | Table 10.
- Page 217 and 218:
| Department of Defence | Table 10.
- Page 219 and 220:
Utilisation of Consultants | Depart
- Page 221 and 222:
| Department of Defence | APPENDIX
- Page 223 and 224:
Conclusion | Department of Defence
- Page 225 and 226:
| Department of Defence | APPENDIX
- Page 227 and 228:
• • • • • The Note of Exc
- Page 229 and 230:
• • • • | Department of Def
- Page 231 and 232:
| Department of Defence | APPENDIX
- Page 233 and 234:
Donor Country (Source) Type of Aid
- Page 235 and 236:
| Department of Defence | Vote 20 |
- Page 237 and 238: | Department of Defence | Vote 20 |
- Page 239 and 240: | Department of Defence | Vote 20 |
- Page 241 and 242: | Department of Defence | Vote 20 |
- Page 243 and 244: | Department of Defence | Vote 20 |
- Page 245 and 246: | Department of Defence | Vote 20 |
- Page 247 and 248: | Department of Defence | Vote 20 |
- Page 249 and 250: | Department of Defence | Vote 20 |
- Page 251 and 252: | Department of Defence | Vote 20 |
- Page 253 and 254: | Department of Defence | Vote 20 |
- Page 255 and 256: | Department of Defence | Vote 20 |
- Page 257 and 258: | Department of Defence | Vote 20 |
- Page 259 and 260: | Department of Defence | Vote 20 |
- Page 261 and 262: | Department of Defence | Vote 20 |
- Page 263 and 264: | Department of Defence | Vote 20 |
- Page 265 and 266: | Department of Defence | Vote 20 |
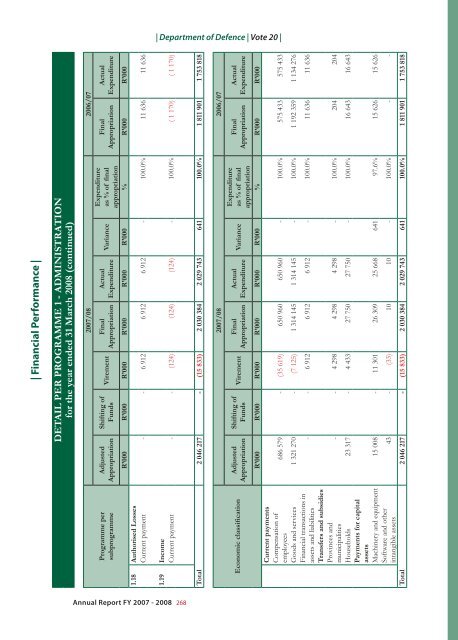
- Page 267 and 268: | Department of Defence | Vote 20 |
- Page 269 and 270: | Department of Defence | Vote 20 |
- Page 271 and 272: Matters of governance | Department
- Page 273 and 274: | Department of Defence | Vote 20 |
- Page 275 and 276: | Department of Defence | Vote 20 |
- Page 277 and 278: 3.5 Unauthorised expenditure | Depa
- Page 279 and 280: | Department of Defence | Vote 20 |
- Page 281 and 282: | Department of Defence | Vote 20 |
- Page 283 and 284: APPROPRIATION STATEMENT for the yea
- Page 285 and 286: DETAIL PER PROGRAMME 1 - ADMINISTRA
- Page 287: DETAIL PER PROGRAMME 1 - ADMINISTRA
- Page 291 and 292: DETAIL PER PROGRAMME 2 - LANDWARD D
- Page 293 and 294: DETAIL PER PROGRAMME 3 - AIR DEFENC
- Page 295 and 296: DETAIL PER PROGRAMME 3 - AIR DEFENC
- Page 297 and 298: DETAIL PER PROGRAMME 4 - MARITIME D
- Page 299 and 300: DETAIL PER PROGRAMME 4 - MARITIME D
- Page 301 and 302: DETAIL PER PROGRAMME 5 - MILITARY H
- Page 303 and 304: DETAIL PER PROGRAMME 6 - DEFENCE IN
- Page 305 and 306: DETAIL PER PROGRAMME 7 - JOINT SUPP
- Page 307 and 308: DETAIL PER PROGRAMME 7 - JOINT SUPP
- Page 309 and 310: DETAIL PER PROGRAMME 8 - FORCE EMPL
- Page 311 and 312: DETAIL PER PROGRAMME 9 - SPECIAL DE
- Page 313 and 314: | Department of Defence | Vote 20 |
- Page 315 and 316: ASSETS | Department of Defence | Vo
- Page 317 and 318: | Department of Defence | Vote 20 |
- Page 319 and 320: | Department of Defence | Vote 20 |
- Page 321 and 322: | Department of Defence | Vote 20 |
- Page 323 and 324: | Department of Defence | Vote 20 |
- Page 325 and 326: 13.1 Staff debtors | Department of
- Page 327 and 328: | Department of Defence | Vote 20 |
- Page 329 and 330: | Department of Defence | Vote 20 |
- Page 331 and 332: | Department of Defence | Vote 20 |
- Page 333 and 334: 32. Tangible Capital Assets | Depar
- Page 335 and 336: ANNEXURES TO THE ANNUAL FINANCIAL S
- Page 337 and 338: ANNEXURES TO THE ANNUAL FINANCIAL S
- Page 339 and 340:
ANNEXURES TO THE ANNUAL FINANCIAL S
- Page 341 and 342:
ANNEXURES TO THE ANNUAL FINANCIAL S
- Page 343 and 344:
ANNEXURES TO THE ANNUAL FINANCIAL S
- Page 345 and 346:
ANNEXURES TO THE ANNUAL FINANCIAL S
- Page 347 and 348:
ANNEXURES TO THE ANNUAL FINANCIAL S
- Page 349 and 350:
ANNEXURES TO THE ANNUAL FINANCIAL S
- Page 351 and 352:
ANNEXURES TO THE ANNUAL FINANCIAL S
- Page 353 and 354:
| Department of Defence | Vote 20 |
- Page 355 and 356:
OTHER MATTERS | Department of Defen
- Page 357 and 358:
ASSETS | Department of Defence | Vo
- Page 359 and 360:
| Department of Defence | Vote 20 |
- Page 361 and 362:
1. Accounting policy | Department o
- Page 363 and 364:
| Department of Defence | Vote 20 |
- Page 365 and 366:
| Department of Defence | Vote 20 |
- Page 367 and 368:
| Department of Defence | Vote 20 |
- Page 369 and 370:
| Department of Defence | List of A