Deutsches Treibhausgasinventar 1990 - 2002 - Umweltbundesamt
Deutsches Treibhausgasinventar 1990 - 2002 - Umweltbundesamt
Deutsches Treibhausgasinventar 1990 - 2002 - Umweltbundesamt

Erfolgreiche ePaper selbst erstellen
Machen Sie aus Ihren PDF Publikationen ein blätterbares Flipbook mit unserer einzigartigen Google optimierten e-Paper Software.
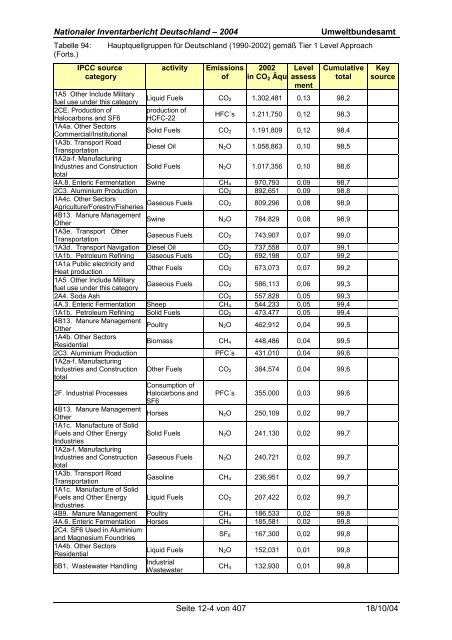
Nationaler Inventarbericht Deutschland – 2004<br />
Tabelle 94:<br />
(Forts.)<br />
IPCC source<br />
category<br />
<strong>Umweltbundesamt</strong><br />
Hauptquellgruppen für Deutschland (<strong>1990</strong>-<strong>2002</strong>) gemäß Tier 1 Level Approach<br />
activity<br />
Emissions<br />
of<br />
<strong>2002</strong><br />
in CO 2 Äqu<br />
Level<br />
assess<br />
ment<br />
Cumulative<br />
total<br />
1A5 Other Include Military<br />
fuel use under this category<br />
Liquid Fuels CO 2 1.302,481 0,13 98,2<br />
2CE. Production of<br />
production of<br />
Halocarbons and SF6 HCFC-22<br />
HFC´s 1.211,750 0,12 98,3<br />
1A4a. Other Sectors<br />
Commercial/Institutional<br />
Solid Fuels CO 2 1.191,809 0,12 98,4<br />
1A3b. Transport Road<br />
Transportation<br />
Diesel Oil N 2O 1.058,863 0,10 98,5<br />
1A2a-f. Manufacturing<br />
Industries and Construction Solid Fuels N 2O 1.017,356 0,10 98,6<br />
total<br />
4A.8. Enteric Fermentation Swine CH 4 970,793 0,09 98,7<br />
2C3. Aluminium Production CO 2 892,651 0,09 98,8<br />
1A4c. Other Sectors<br />
Gaseous Fuels<br />
Agriculture/Forestry/Fisheries<br />
CO2 809,296 0,08 98,9<br />
4B13. Manure Management<br />
Other<br />
Swine N 2O 784,829 0,08 98,9<br />
1A3e. Transport Other<br />
Transportation<br />
Gaseous Fuels CO 2 743,907 0,07 99,0<br />
1A3d. Transport Navigation Diesel Oil CO 2 737,558 0,07 99,1<br />
1A1b. Petroleum Refining Gaseous Fuels CO 2 692,198 0,07 99,2<br />
1A1a Public electricity and<br />
Other Fuels CO 2 673,073 0,07 99,2<br />
Heat production<br />
1A5 Other Include Military<br />
fuel use under this category<br />
Gaseous Fuels CO 2 586,113 0,06 99,3<br />
2A4. Soda Ash CO 2 557,828 0,05 99,3<br />
4A.3. Enteric Fermentation Sheep CH 4 544,233 0,05 99,4<br />
1A1b. Petroleum Refining Solid Fuels CO 2 473,477 0,05 99,4<br />
4B13. Manure Management<br />
Other<br />
Poultry N 2O 462,912 0,04 99,5<br />
1A4b. Other Sectors<br />
Residential<br />
Biomass CH 4 448,486 0,04 99,5<br />
2C3. Aluminium Production PFC´s 431,010 0,04 99,6<br />
1A2a-f. Manufacturing<br />
Industries and Construction<br />
total<br />
Other Fuels CO 2 384,574 0,04 99,6<br />
2F. Industrial Processes<br />
Consumption of<br />
Halocarbons and<br />
SF6<br />
PFC´s 355,000 0,03 99,6<br />
4B13. Manure Management<br />
Other<br />
Horses N 2O 250,109 0,02 99,7<br />
1A1c. Manufacture of Solid<br />
Fuels and Other Energy Solid Fuels N 2O 241,130 0,02 99,7<br />
Industries<br />
1A2a-f. Manufacturing<br />
Industries and Construction Gaseous Fuels N 2O 240,721 0,02 99,7<br />
total<br />
1A3b. Transport Road<br />
Transportation<br />
Gasoline CH 4 236,951 0,02 99,7<br />
1A1c. Manufacture of Solid<br />
Fuels and Other Energy Liquid Fuels CO 2 207,422 0,02 99,7<br />
Industries<br />
4B9. Manure Management Poultry CH 4 186,533 0,02 99,8<br />
4A.6. Enteric Fermentation Horses CH 4 185,581 0,02 99,8<br />
2C4. SF6 Used in Aluminium<br />
and Magnesium Foundries<br />
1A4b. Other Sectors<br />
Residential<br />
6B1. Wastewater Handling<br />
SF 6 167,300 0,02 99,8<br />
Liquid Fuels N 2O 152,031 0,01 99,8<br />
Industrial<br />
Wastewater<br />
CH 4 132,930 0,01 99,8<br />
Key<br />
source<br />
Seite 12-4 von 407 18/10/04