Deutsches Treibhausgasinventar 1990 - 2002 - Umweltbundesamt
Deutsches Treibhausgasinventar 1990 - 2002 - Umweltbundesamt
Deutsches Treibhausgasinventar 1990 - 2002 - Umweltbundesamt

Sie wollen auch ein ePaper? Erhöhen Sie die Reichweite Ihrer Titel.
YUMPU macht aus Druck-PDFs automatisch weboptimierte ePaper, die Google liebt.
Nationaler Inventarbericht Deutschland – 2004<br />
IPCC source category activity Emis<br />
sions<br />
of<br />
2B3 Chemical Industry<br />
1A2a-f. Manufacturing<br />
Industries and Construction<br />
total<br />
1A1a Public electricity and<br />
Heat production<br />
2F. Industrial Processes<br />
Adipic Acid<br />
Production<br />
<strong>1990</strong><br />
in CO 2<br />
Äqu<br />
<strong>2002</strong><br />
in CO 2<br />
Äqu<br />
<strong>1990</strong>-<strong>2002</strong><br />
CO 2<br />
Äqu.<br />
<strong>Umweltbundesamt</strong><br />
Trend<br />
assessm<br />
ent<br />
Cumu<br />
lative<br />
total<br />
Key<br />
source<br />
N2O 18.804,600 3.073,726 0,014722 3,28220063 75,5 ●<br />
Gaseous Fuels CO 2 45.750,962 49.594,679 0,014423 3,21555085 78,8 ●<br />
Gaseous Fuels CO 2 18.463,251 26.008,603 0,012971 2,89184517 81,6 ●<br />
Consumption of<br />
Halocarbons and<br />
SF 6<br />
HFC´s 7.035,400 0,008393 1,87109416 83,5 ●<br />
1A3b. Transport Road<br />
Transportation<br />
Gasoline CO 2 95.794,488 84.024,000 0,006558 1,46197100 85,0 ●<br />
1A1b. Petroleum Refining Liquid Fuels CO 2 16.008,949 18.509,179 0,006425 1,43241467 86,4 ●<br />
1A5 Other Include Military<br />
fuel use under this category<br />
Liquid Fuels CO 2 6.659,145 1.302,481 0,004958 1,10538815 87,5 ●<br />
1A4c. Other Sectors<br />
Solid Fuels<br />
Agriculture/Forestry/Fisheries<br />
CO2 4.750,908 74,134 0,004557 1,01604954 88,5 ●<br />
1A5 Other Include Military<br />
fuel use under this category<br />
Solid Fuels CO 2 4.657,327 58,734 0,004484 0,99974316 89,5 ●<br />
1A2a-f. Manufacturing<br />
Industries and Construction<br />
total<br />
Liquid Fuels CO 2 28.391,517 20.506,201 0,003301 0,73604523 90,3 ●<br />
1A1a Public electricity and<br />
Heat production<br />
1A4a. Other Sectors<br />
Commercial/Institutional<br />
1A3a. Transport Civil<br />
Aviation<br />
Liquid Fuels CO 2 8.474,772 4.355,777 0,003091 0,68918386 91,0 ●<br />
Liquid Fuels CO 2 27.280,448 20.248,830 0,002522 0,56226547 91,5 ●<br />
Aviation Gasoline CO 2 2.897,396 4.247,600 0,002234 0,49799340 92,0 ●<br />
6B1. Wastewater Handling<br />
Industrial<br />
Wastewater<br />
CH 4 2.226,210 132,930 0,002018 0,44999223 92,5 ●<br />
2CE. Production of<br />
production of<br />
Halocarbons and SF6 HCFC-22<br />
HFC´s 3.510,000 1.211,750 0,001987 0,44296005 92,9 ●<br />
2C3. Aluminium Production PFC´s 2.486,000 431,010 0,001917 0,42735453 93,3 ●<br />
1A3b. Transport Road<br />
Transportation<br />
Gasoline N2O 2.227,031 3.399,359 0,001877 0,41854912 93,8 ●<br />
1A1b. Petroleum Refining Solid Fuels CO 2 2.381,264 473,477 0,001764 0,39322619 94,1 ●<br />
1A4b. Other Sectors<br />
Residential<br />
Solid Fuels CH 4 1.809,335 77,179 0,001677 0,37393488 94,5 ●<br />
4A.1. Enteric Fermentation Non-Dairy Cattle CH 4 20.011,612 17.664,908 0,001504 0,33523951 94,9 ●<br />
1A2a-f. Manufacturing<br />
Industries and Construction<br />
total<br />
Other Fuels CO 2 1.922,710 384,574 0,001421 0,31689920 95,2 ●<br />
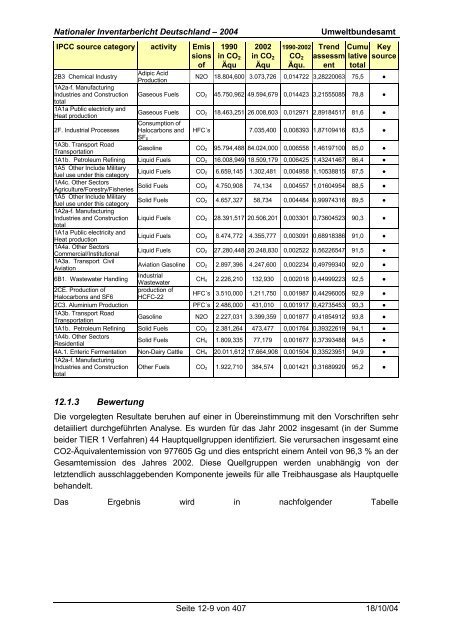
12.1.3 Bewertung<br />
Die vorgelegten Resultate beruhen auf einer in Übereinstimmung mit den Vorschriften sehr<br />
detaiiliert durchgeführten Analyse. Es wurden für das Jahr <strong>2002</strong> insgesamt (in der Summe<br />
beider TIER 1 Verfahren) 44 Hauptquellgruppen identifiziert. Sie verursachen insgesamt eine<br />
CO2-Äquivalentemission von 977605 Gg und dies entspricht einem Anteil von 96,3 % an der<br />
Gesamtemission des Jahres <strong>2002</strong>. Diese Quellgruppen werden unabhängig von der<br />
letztendlich ausschlaggebenden Komponente jeweils für alle Treibhausgase als Hauptquelle<br />
behandelt.<br />
Das Ergebnis wird in nachfolgender Tabelle<br />
Seite 12-9 von 407 18/10/04