- Page 1 and 2:
PROCEEDINGS OF The International Bu
- Page 3 and 4:
Proceedings of the International Bu
- Page 5 and 6:
Costs and Benefits of Marketing Com
- Page 7 and 8:
Sources of Competitive Advantage in
- Page 9 and 10:
INNOVATIVE THINKING AS A REQUIREMEN
- Page 11 and 12:
The participants of the conducted s
- Page 13 and 14:
thinking: nature, specific traits,
- Page 15 and 16:
4. The training programs aimed at t
- Page 17 and 18:
second reason lies in the specifics
- Page 19 and 20:
Conclusions To sum up, it should be
- Page 21 and 22:
the impact of the macro-environment
- Page 23 and 24:
Creativity Figure 2. The structure
- Page 25 and 26:
Boden (2004) distinguishes two broa
- Page 27 and 28:
consists of factors and trends oper
- Page 29 and 30:
Druzhinin, 1999 Gebert, 2002 Krause
- Page 31 and 32:
Table 4. Details of the respondents
- Page 33 and 34:
Figure 5. Distribution of expectati
- Page 35 and 36:
climate, which obstructs the expres
- Page 37 and 38:
Simonton, D. K. (2003). Scientific
- Page 39 and 40:
Unlocking and diffusing environment
- Page 41 and 42:
11. Aping: a copy cat is possible b
- Page 43 and 44:
finding tours, network sessions, id
- Page 45 and 46:
Conclusions Although this research
- Page 47 and 48:
THE INTERFACE BETWEEN THE STUDENTS
- Page 49 and 50:
135 (47.4 percent) students, the re
- Page 51 and 52:
and agreeableness. Most researchers
- Page 53 and 54:
individuals with strongly expressed
- Page 55 and 56:
of statistics were identified in th
- Page 57 and 58:
When analysing the data of the Crea
- Page 59 and 60:
Childishness 5.77 1.79 5.46 1.66 1.
- Page 61 and 62:
Generalizing the obtained results i
- Page 63 and 64:
openness to experience in students
- Page 65 and 66:
the third year students, as well as
- Page 67 and 68:
Wang, N., Jome, L. M., Haase, R. F.
- Page 69 and 70:
Csikszentmihalyi (1991) concurs and
- Page 71 and 72:
Pictures, imaging, perception and m
- Page 73 and 74:
participants had given their consen
- Page 75 and 76:
Kirkpatrick D. (1994) cited Rigg &
- Page 77 and 78:
the ability to transform the existi
- Page 79 and 80:
Almost 70 percent of the students i
- Page 81 and 82:
The respondents studying at the Fac
- Page 83 and 84:
with other faculties who are willin
- Page 85 and 86:
INNOVATIVE AND CREATIVE ICT SOLUTIO
- Page 87 and 88:
The author suggests that the proces
- Page 89 and 90:
activity (e.g. between two and thre
- Page 91 and 92:
characteristics of innovative ICT s
- Page 93 and 94:
Innovative and creative business so
- Page 95 and 96:
type of projector. Its type and cap
- Page 97 and 98:
Badzioska, E. (2016). The Concept o
- Page 99 and 100:
BUILDING RESILIENT ORGANIZATIONS AN
- Page 101 and 102:
Even though open innovation is most
- Page 103 and 104:
Most of the wood construction -rela
- Page 105 and 106:
MEE (Finnish Ministry of Employment
- Page 107 and 108:
the concept. Conceptual layer is co
- Page 109 and 110:
It is important to indicate the acc
- Page 111 and 112:
elationship can have the impact on
- Page 113 and 114:
THE USE OF TIME-DRIVEN ACTIVITY BAS
- Page 115 and 116:
The term of time consuming includes
- Page 117 and 118:
Table 1. The time equation of purch
- Page 119 and 120:
In the classical approach of accoun
- Page 121 and 122:
COSTS AND BENEFITS OF MARKETING COM
- Page 123 and 124:
Marketing experts A total of 13 mar
- Page 125 and 126:
No common rules, but facilitators D
- Page 127 and 128:
For radio spots and TV ads, adverti
- Page 129 and 130:
interviewed companies were locally
- Page 131 and 132:
(Objectives of) the most used and b
- Page 133 and 134:
Table 7. Correlation of interest in
- Page 135 and 136:
selected by companies amid various
- Page 137 and 138:
Exhibit 1). This shows a clear conn
- Page 139 and 140:
Brand awareness is thought to accru
- Page 141 and 142:
celebration, victory and the epitom
- Page 143 and 144:
eaching and identifying with their
- Page 145 and 146:
2014). This worked to increase awar
- Page 147 and 148:
Exhibit 6. Impact of Marketing Tech
- Page 149 and 150:
McDonald, Colin. (1991). Sponsorshi
- Page 151 and 152:
products dedicated to older consume
- Page 153 and 154:
The study was conducted in November
- Page 155 and 156:
The study was conducted by question
- Page 157 and 158:
The research results also showed th
- Page 159 and 160:
stages. (Freeman, Soete, 2001). Kul
- Page 161 and 162:
and process innovations and innovat
- Page 163 and 164:
company's innovation culture. For e
- Page 165 and 166:
Conclusions Reviewing the definitio
- Page 167 and 168:
ONE DOWNTOWN STREET. ONE DOWNTOWN P
- Page 169 and 170:
construction of new ones while othe
- Page 171 and 172:
association of post-earthquake buil
- Page 173 and 174:
After carrying out of this inquiry,
- Page 175 and 176:
SOCIAL MEDIA AND ITS INFLUENCES ON
- Page 177 and 178:
Social Media Definition of social m
- Page 179 and 180:
Forums Perhaps the forums came befo
- Page 181 and 182:
find 80% their prefer shops online
- Page 183 and 184:
ASSESSMENT OF DIFFERENT GENERATION
- Page 185 and 186:
Table 1. Generations of Georgian po
- Page 187 and 188:
FOOD-RELATED LIFESTYLE AS AN INNOVA
- Page 189 and 190:
The eco-moderate food consumer, Th
- Page 191 and 192:
Source: author’s elaboration. Fig
- Page 193 and 194:
Cholewa-Wójcik, A., & Świda, J. (
- Page 195 and 196:
The aim of work is to analyze diffe
- Page 197 and 198:
The results of empirical research c
- Page 199 and 200:
Legal framework According Hattori a
- Page 201 and 202:
on companies as it’s a key elemen
- Page 203 and 204:
Figure 5. Opinion about false adver
- Page 205 and 206:
EVALUATION OF POSSIBILITIES TO CHAN
- Page 207 and 208:
logistics is to save resources, to
- Page 209 and 210:
Figure 2. Review of Cargo handling
- Page 211 and 212:
Air pollution passes into other sph
- Page 213 and 214:
Figure 6. The Cascade bulk cargo ha
- Page 215 and 216:
Figure 8. Principle of dust suppres
- Page 217 and 218:
WHEN SHARED VALUE MEETS CREATIVITY:
- Page 219 and 220:
Figure 1. Value creation framework
- Page 221 and 222:
in private people who are oriented
- Page 223 and 224:
“Creative thinking led to Nobel P
- Page 225 and 226:
offer the machine, for free. Then t
- Page 227 and 228:
Yunus, M., Dalsace, F., Menasce, D.
- Page 229 and 230:
Clearly declarative character, mani
- Page 231 and 232:
management, because it would mean t
- Page 233 and 234:
of companies do not see the need to
- Page 235 and 236:
Figure 6. Problems noticed in enter
- Page 237 and 238:
epresentatives of SMEs have a right
- Page 239 and 240: practitioners have developed their
- Page 241 and 242: Table 2. Industrial state problems
- Page 243 and 244: Acting boldly without being limited
- Page 245 and 246: SOCIAL STAKEHOLDERS APPROACH TO TRA
- Page 247 and 248: Assessing Vilniaus kolegija/Univers
- Page 249 and 250: graduates were useful for their ins
- Page 251 and 252: S. Pogosian and I. Dzemyda (2012) n
- Page 253 and 254: European policies toward flexible w
- Page 255 and 256: the “Law on Temporary Agency Empl
- Page 257 and 258: where staff where engaged in tempor
- Page 259 and 260: Edquist C. & Hommen L. Comparing na
- Page 261 and 262: In 1997, this ‘overly constricted
- Page 263 and 264: Figure 1. Major themes identified d
- Page 265 and 266: Given that SMEs were shaped by thei
- Page 267 and 268: approached in the recent study by J
- Page 269 and 270: Foreman-Peck, J., & Nicholls, T. (2
- Page 271 and 272: unemployment? Journal of Business V
- Page 273 and 274: Business related innovation phenome
- Page 275 and 276: Schumpeter was one of the foremost
- Page 277 and 278: from OECD member countries (OECD, 2
- Page 279 and 280: Marketing innovation Organisational
- Page 281 and 282: Figure 1. The rate of innovation-ac
- Page 283 and 284: to promote and foster involvement o
- Page 285 and 286: ASSESSING FINANCIAL INCLUSION OF EN
- Page 287 and 288: positive relationships in different
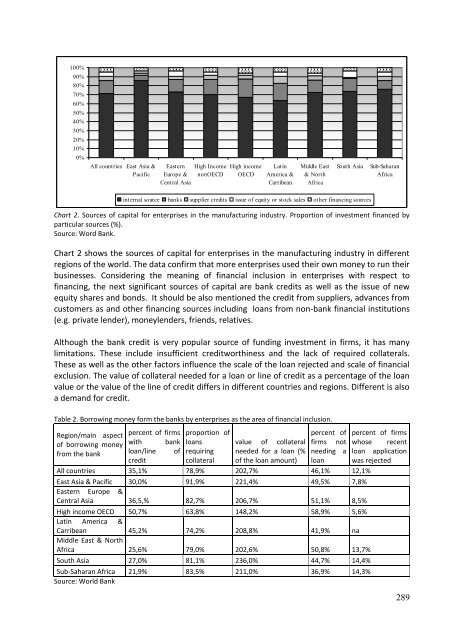
- Page 289: 120% 100% 80% 60% 40% 20% 0% All co
- Page 293 and 294: Puri M., Rocholl J. Steffen S. (201
- Page 295 and 296: committees. The analysis of advanta
- Page 297 and 298: getting in turn their board represe
- Page 299 and 300: limit of involvement in an investme
- Page 301 and 302: and relatively save. However in the
- Page 303 and 304: A separate investment bank, without
- Page 305 and 306: Zielioski T. (2013), "Zarażenie fi
- Page 307 and 308: encompasses economic, political, so
- Page 309 and 310: management model existing in Great
- Page 311 and 312: Individualism-collectivism dimensio
- Page 313 and 314: The lowest indicator is obtained in
- Page 315 and 316: The power distance indicator in Lit
- Page 317 and 318: After performing a comparative anal
- Page 319 and 320: INNOVATION, ECONOMIC GROWTH, AND IN
- Page 321 and 322: citizens and gain popularity in abr
- Page 323 and 324: eduction of state and private inves
- Page 325 and 326: In 2013 were finished negotiations
- Page 327 and 328: THE PERCEPTIONS OF PARTNERS’ TRUS
- Page 329 and 330: small and medium sized and represen
- Page 331 and 332: Figure 2. Conceptual map of the Rus
- Page 333 and 334: Miles, M.B. & Huberman, A. M. (1994
- Page 335 and 336: Will to discuss issues Issues can b
- Page 337 and 338: Competent in Russian business Trans
- Page 339 and 340: Appendix 3. Trustworthiness cluster
- Page 341 and 342:
SOURCES OF COMPETITIVE ADVANTAGE IN
- Page 343 and 344:
for sources of competitive advantag
- Page 345 and 346:
The competitive advantage of compan
- Page 347 and 348:
discrepancy of responses was slight
- Page 349 and 350:
Budzyoska-Biernat A. (2015). Strate
- Page 351 and 352:
the economy of European countries m
- Page 353 and 354:
Scientific literature emphasizes th
- Page 355 and 356:
The European Parliament and the Cou
- Page 357 and 358:
No. Competence Score Group No. Comp
- Page 359 and 360:
When generalizing the research resu
- Page 361 and 362:
SUSTAINABLE TOURISM AND SOCIAL TOUR
- Page 363 and 364:
organizations and institutions resp
- Page 365 and 366:
Municipalities were chosen in a way
- Page 367 and 368:
On the other hand the highest mean
- Page 369 and 370:
A major contribution of this resear
- Page 371 and 372:
Shin, Y. (2010). Residents' Percept
- Page 373 and 374:
Hence, Georgia has made a big succe
- Page 375 and 376:
driving forces for massive employme
- Page 377 and 378:
Figure 3. Credit (ECTs) distributio
- Page 379 and 380:
There are provided good organizatio
- Page 381 and 382:
Academic representatives to receive
- Page 383 and 384:
total exports. Travel & Tourism inv
- Page 385 and 386:
trends in the development of touris
- Page 387 and 388:
philosopher Arsene Ikaltoeli taught
- Page 389 and 390:
Terms of fierce competition in the
- Page 391 and 392:
PROMOTING INNOVATION IN THE HOTEL I
- Page 393 and 394:
Leadership in Energy and Environmen
- Page 395 and 396:
Conclusions This article reviewed i
- Page 397:
ISBN Ba Proceedings of the Internat