2294 part 1 final report.pdf - Agra CEAS Consulting
2294 part 1 final report.pdf - Agra CEAS Consulting
2294 part 1 final report.pdf - Agra CEAS Consulting

You also want an ePaper? Increase the reach of your titles
YUMPU automatically turns print PDFs into web optimized ePapers that Google loves.
Prevention and control of animal diseases worldwide<br />
Part I: Economic analysis: prevention versus outbreak costs<br />
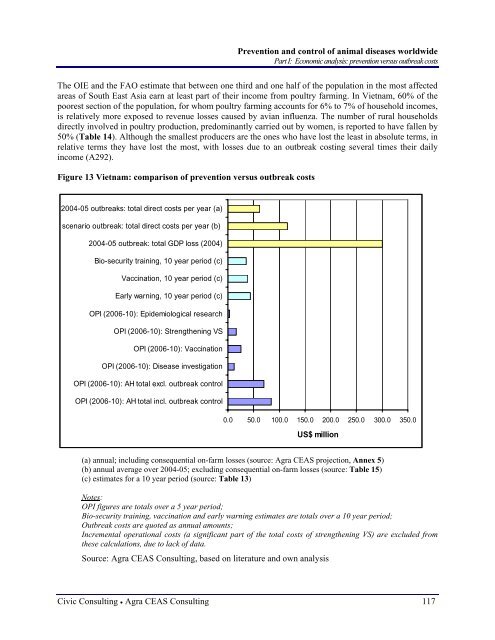
The OIE and the FAO estimate that between one third and one half of the population in the most affected<br />
areas of South East Asia earn at least <strong>part</strong> of their income from poultry farming. In Vietnam, 60% of the<br />
poorest section of the population, for whom poultry farming accounts for 6% to 7% of household incomes,<br />
is relatively more exposed to revenue losses caused by avian influenza. The number of rural households<br />
directly involved in poultry production, predominantly carried out by women, is <strong>report</strong>ed to have fallen by<br />
50% (Table 14). Although the smallest producers are the ones who have lost the least in absolute terms, in<br />
relative terms they have lost the most, with losses due to an outbreak costing several times their daily<br />
income (A292).<br />
Figure 13 Vietnam: comparison of prevention versus outbreak costs<br />
2004-05 outbreaks: total direct costs per year (a)<br />
scenario outbreak: total direct costs per year (b)<br />
2004-05 outbreak: total GDP loss (2004)<br />
Bio-security training, 10 year period (c)<br />
Vaccination, 10 year period (c)<br />
Early warning, 10 year period (c)<br />
OPI (2006-10): Epidemiological research<br />
OPI (2006-10): Strengthening VS<br />
OPI (2006-10): Vaccination<br />
OPI (2006-10): Disease investigation<br />
OPI (2006-10): AH total excl. outbreak control<br />
OPI (2006-10): AH total incl. outbreak control<br />
0.0 50.0 100.0 150.0 200.0 250.0 300.0 350.0<br />
US$ million<br />
(a) annual; including consequential on-farm losses (source: <strong>Agra</strong> <strong>CEAS</strong> projection, Annex 5)<br />
(b) annual average over 2004-05; excluding consequential on-farm losses (source: Table 15)<br />
(c) estimates for a 10 year period (source: Table 13)<br />
Notes:<br />
OPI figures are totals over a 5 year period;<br />
Bio-security training, vaccination and early warning estimates are totals over a 10 year period;<br />
Outbreak costs are quoted as annual amounts;<br />
Incremental operational costs (a significant <strong>part</strong> of the total costs of strengthening VS) are excluded from<br />
these calculations, due to lack of data.<br />
Source: <strong>Agra</strong> <strong>CEAS</strong> <strong>Consulting</strong>, based on literature and own analysis<br />
Civic <strong>Consulting</strong> • <strong>Agra</strong> <strong>CEAS</strong> <strong>Consulting</strong> 117