- Page 1:
Сибирское отделени
- Page 5:
PLENARY LECTURES
- Page 8 and 9:
PL-1“nucleophily”, “electroph
- Page 10 and 11:
PL-2This presentation will focus on
- Page 12 and 13:
PL-3NOBLE METALS CONTAINING CATALYS
- Page 14 and 15:
PL-4KINETICS AND MECHANISM OF SELEC
- Page 16 and 17:
PL-5the possibility of performing s
- Page 18 and 19:
PL-6MULTINUCLEAR NMR IMAGING IN CAT
- Page 20 and 21:
PL-6At the same time, other excitin
- Page 23 and 24:
KS-I-1THE EFFECTS OF ACTIVE SITE CO
- Page 25 and 26:
С 2 -С 3 OLEFIN PRODUCTION PATHWA
- Page 27 and 28:
- process (3) can be important in t
- Page 29 and 30:
OOOOZ mO OXOO XO nYO O n-2(I) HY(II
- Page 31 and 32:
KS-I-4В настоящей раб
- Page 33 and 34:
TAP-APPROACH IN CATALYTIC MECHANISM
- Page 35 and 36:
KS-I-6pressure study. For this inve
- Page 37 and 38:
NEW ADVANCED CATALYSTS ON THE BASIS
- Page 39 and 40:
KS-II-1Многочисленны
- Page 41 and 42:
KS-II-2The following approaches tha
- Page 43 and 44:
KS-II-4KINETIC FEATURES AND MECHANI
- Page 45 and 46:
KS-II-4от характера ли
- Page 47 and 48:
KS-II-5В работе проана
- Page 49 and 50:
KS-II-6Me 3 , 1,2,4-Me 3 , Me 4 ).
- Page 51 and 52:
KS-III-1INTENSITY OF IR-ADSORPTION
- Page 53 and 54:
APPLICATION OF SURFACE SCIENCE PHYS
- Page 55 and 56:
KS-III-2преимуществом
- Page 57 and 58:
KS-III-3ON THE REGULARITIES OF THE
- Page 59 and 60:
KS-III-3пропилена, то н
- Page 61 and 62:
KS-III-4K on the same sites that ac
- Page 63 and 64:
KS-III-5комплекс вопро
- Page 65:
CAN QUANTUM CHEMISTRY HELP TO TAYLO
- Page 69 and 70:
OP-I-1MECHANISMS OF HETEROGENEOUS C
- Page 71 and 72:
OP-I-2Рис. 1. Зависимос
- Page 73 and 74:
CARBON OXIDE HYDROGENATION OVER Fe-
- Page 75 and 76:
OP-I-3значения полос
- Page 77 and 78:
OP-I-4цеолита, а при с
- Page 79 and 80:
IRON EFFECT UPON ALKANES CRACKING O
- Page 81 and 82:
OP-I-5На поверхности
- Page 83 and 84:
OP-I-6acidity measurements of the H
- Page 85 and 86:
OP-I-7Н 2 -D 2 обмен иссл
- Page 87 and 88:
OP-I-8NOVEL WAY TO THE SYNTHESIS OF
- Page 89 and 90:
OP-I-8глиоксалю - сост
- Page 91 and 92:
OP-I-9their intensities, new appear
- Page 93 and 94:
OP-I-10activity even with platinum.
- Page 95 and 96:
OP-I-10part of CPSS was straightfor
- Page 97 and 98:
OP-I-11Однако при гидр
- Page 99 and 100:
OP-I-12MOLECULAR MECHANISM OF THE L
- Page 101 and 102:
OP-I-12по сравнению с
- Page 103 and 104:
OP-I-13over other catalysts in fine
- Page 105 and 106:
OP-I-14поперек и под у
- Page 107 and 108:
OP-I-15After performing an ageing t
- Page 109 and 110:
OP-I-16oxidized to Sn 4+ [4,5]. In
- Page 111 and 112:
OP-I-17INFLUENCE OF THE LATTICE OXY
- Page 113 and 114:
OP-I-18NEW CATALYST OF LOW-TEMPERAT
- Page 115 and 116:
OP-I-19COMPARATIVE STUDY OF METHANE
- Page 117 and 118:
OP-I-19syngas selectivity is due to
- Page 119 and 120:
OP-I-20EFFECT OF OXYGEN MOBILITY ON
- Page 121 and 122:
селективности. В эт
- Page 123 and 124:
OP-I-21поликристаллич
- Page 125 and 126:
OP-I-22SELECTIVE СО OXIDATION: RE
- Page 127 and 128:
OP-I-22Как видно из ри
- Page 129 and 130:
OP-I-23установлению к
- Page 131 and 132:
OP-I-24CATALYTIC PERFORMANCE OF COP
- Page 133 and 134:
OP-I-25MECHANISMS OF METHANE CHLORI
- Page 135 and 136:
OP-I-25При исследован
- Page 137 and 138:
OP-I-26За модельные мо
- Page 139 and 140:
OP-I-27INFLUENCE OF SECOND METAL AD
- Page 141 and 142:
OP-I-28ACTIVITY AND DEACTIVATION OF
- Page 143 and 144:
OP-I-28а содержание бе
- Page 145 and 146:
OP-I-29хлористого вод
- Page 147 and 148:
THE MECHANISM OF CHLORINE GENERATIO
- Page 149 and 150:
OP-I-30Значения конст
- Page 151 and 152:
OP-I-31ТХБ, растворите
- Page 153 and 154:
OP-I-32Наряду с хлорид
- Page 155 and 156:
CATALYTIC TRANSFORMATIONS OF ALIPHA
- Page 157 and 158:
OP-I-34STRONG METAL-SUPPORT INTERAC
- Page 159 and 160:
OP-I-34The reduction extent of Ni 2
- Page 161 and 162:
OP-I-35impregnating solutions for c
- Page 163 and 164:
FEATURES OF CATALYSTS EMPLOYMENT FO
- Page 165 and 166:
OP-I-361 - NH 3 (14,5), H 2 S (4,1)
- Page 167 and 168:
OP-I-37В условиях реак
- Page 169 and 170:
OP-I-38ROLE OF REDOX- AND ACIDIC CE
- Page 171 and 172:
OP-I-38Таблица 2. Актив
- Page 173 and 174:
OP-I-39Таблица 1. Влиян
- Page 175 and 176:
OP-I-40гидроксосилика
- Page 177 and 178:
OP-I-41(рис.1). Дегидрир
- Page 179 and 180:
PROTON TRANSFER REACTIONSIN TRANSIT
- Page 181 and 182:
OP-II-1elucidation of the mechanism
- Page 183 and 184:
OP-II-2oscillations of E Pt and pH
- Page 185 and 186:
OP-II-3гексана в польз
- Page 187 and 188:
OP-II-3более мягкий пу
- Page 189 and 190:
R 1OCa 2+OH -OHR 2Рис. 1. Пер
- Page 191 and 192:
STUDY OF THE MECHANISM OF CATALYTIC
- Page 193 and 194:
MECHANISM OF PHENOL AND ANILINE ALK
- Page 195 and 196:
OP-II-7MECHANISM OF FORMATION OF HY
- Page 197 and 198:
OP-II-8CATALYTIC AND PHYSICOCHEMICA
- Page 199 and 200:
OP-II-8To sum up we can say that Pt
- Page 201 and 202:
OP-II-9величины изоме
- Page 203 and 204:
OP-II-9увеличением со
- Page 205 and 206:
OP-II-10the second metal are still
- Page 207 and 208:
OP-II-11которых химизм
- Page 209 and 210:
OP-II-116. Co(Ni)Mo-катализ
- Page 211 and 212:
OP-II-12гг-1, которая от
- Page 213 and 214:
OP-II-13ROLE OF THE SOLVENT IN THE
- Page 215 and 216:
OP-II-14KINETICS AND MECHANISM OF P
- Page 217 and 218:
O 2H 2 OFeX 2FeX 3I 2HIBuOHP n , Zn
- Page 219 and 220:
OP-II-15capable of asymmetric oxida
- Page 221 and 222:
OP-II-16Систематическ
- Page 223 and 224:
OP-II-17MECHANISM OF ETHYLENE METHO
- Page 225 and 226:
OP-II-18MECHANISM OF LIQUID-PHASE C
- Page 227 and 228:
OP-II-18катализатора и
- Page 229 and 230:
OP-II-19Основным недос
- Page 231 and 232:
OP-II-19Литература:1 Шн
- Page 233 and 234:
OP-II-20Surprising is the finding t
- Page 235 and 236:
OP-II-21ºC) [7]. Полученн
- Page 237 and 238:
OP-II-21Настоящая рабо
- Page 239 and 240:
OP-II-22W(VI), Ti(IV), Re(VII), х
- Page 241 and 242:
OP-II-23MECHANISM OF ACTIVATION AND
- Page 243 and 244:
OP-II-23содержащей сис
- Page 245 and 246:
2+2+OP-II-24O25 31 (R=Me)OORD 2/ Ru
- Page 247 and 248:
OP-II-25ASYMMETRIC HYDROGENATION OF
- Page 249 and 250:
MECHANISM OF TRIMETHYLPENTANE AND D
- Page 251 and 252:
OP-II-26СХЕМА 3. Наибол
- Page 253 and 254:
OP-II-27диенофилов - ма
- Page 255 and 256:
OP-II-28H 2 MoO 4 и FeMoO 4 поз
- Page 257 and 258:
OP-II-29THE CATALYTIC ACTION OF AMM
- Page 259 and 260: OP-II-29Как и в случае
- Page 261 and 262: THE KINETICS AND MECHANISM OF P-TOL
- Page 263 and 264: OP-II-30PhCH-CH 2O+SHKk1 +PhCH-CH 2
- Page 265 and 266: OP-II-31Согласно данны
- Page 267 and 268: OP-II-32TRANSFORMATION OF SULFUR OR
- Page 269 and 270: Рисунок 1OP-II-32269
- Page 271 and 272: OP-II-33скорость образ
- Page 273 and 274: FCC GASOLINE SULFUR REDUCTION ADDIT
- Page 275 and 276: OP-II-35NOVEL HETEROGENIZED NICKEL
- Page 277 and 278: OP-II-35повышена до 60-80
- Page 279 and 280: OP-II-36provide stable experimentat
- Page 281 and 282: DISCRIMINATION OF KINETIC MODELS OF
- Page 283 and 284: OP-II-37Однако при уве
- Page 285 and 286: OP-II-38Для этих систе
- Page 287 and 288: OP-II-39раскрывается п
- Page 289 and 290: OP-II-40TITANIUM-MAGNESIUM CATALYST
- Page 291 and 292: OP-II-41MECHANISM OF BUTADIENE POLY
- Page 293 and 294: OP-II-41Нами установле
- Page 295 and 296: OP-II-42тщательно пром
- Page 297 and 298: OP-II-43обрыва или пер
- Page 299 and 300: OP-II-44MECHANISMS OF HIGHER α-OLE
- Page 301 and 302: OP-II-44С учётом разни
- Page 303 and 304: OP-II-45сополимеры, пр
- Page 305 and 306: OP-III-1Разбавление аз
- Page 307 and 308: OP-III-1Из таблицы 1 ви
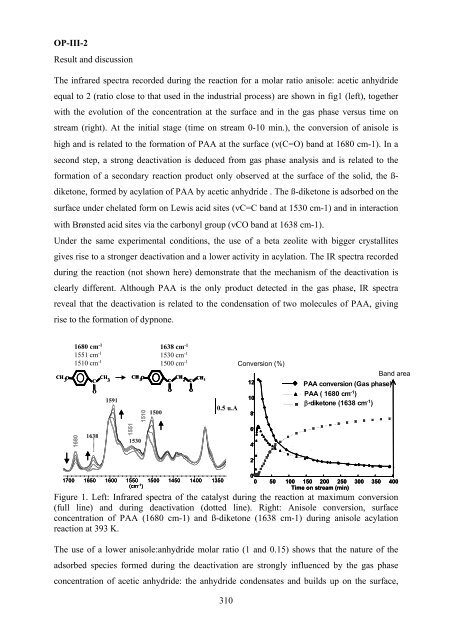
- Page 309: OP-III-2OPERANDO INFRARED STUDY OF
- Page 313 and 314: OP-III-3С этих позиций
- Page 315 and 316: OP-III-4центров двух т
- Page 317 and 318: OP-III-5аналогов, соде
- Page 319 and 320: OP-III-6QUANTUM-CHEMICAL STUDY OF T
- Page 321 and 322: OP-III-6Hn(H 2 C) ON BHH 3 BBH 3HPh
- Page 323 and 324: OP-III-7положения заме
- Page 325 and 326: OP-III-8поверхностног
- Page 327 and 328: OP-III-9поверхностных
- Page 332 and 333: OP-III-11THERMODYNAMIC CHARACTERIST
- Page 334 and 335: OP-III-11which corresponds to ΔS°
- Page 336 and 337: OP-III-12i[ Cp2ZrHCl⋅2] 2iiX6= HA
- Page 338 and 339: OP-III-13MOLECULAR MECHANISM OF 1,2
- Page 340 and 341: OP-III-13changes to the formation o
- Page 342 and 343: OP-III-14Рис. Синергиче
- Page 344 and 345: OP-III-15Содержание во
- Page 346 and 347: OP-III-16XPS AND NEXAFS IN-SITU INV
- Page 348 and 349: OP-III-17THERMAL STABILITY OF GOLD
- Page 350 and 351: OP-III-17Там, где спека
- Page 352 and 353: OP-III-18Окисление Н 2 .
- Page 354 and 355: OP-III-18режима протек
- Page 356 and 357: OP-III-19палладия адсо
- Page 358 and 359: OP-III-20THE ADSORBED OXYGEN SPECIE
- Page 360 and 361:
OP-III-20Воздействие н
- Page 362 and 363:
OP-III-21and selective oxidation of
- Page 364 and 365:
OP-III-22STM/XPS STUDY OF MODEL CAT
- Page 366 and 367:
OP-III-22Разработанная
- Page 368 and 369:
OP-III-23Образцы редко
- Page 370 and 371:
OP-III-24IN SITU GAS-PHASE X-RAY PH
- Page 372 and 373:
OP-III-24Перед каталит
- Page 374 and 375:
OP-III-25width ΔH = 7-100G. The pa
- Page 376 and 377:
OP-III-26структуры, но
- Page 378 and 379:
OP-III-27скорости реак
- Page 380 and 381:
OP-III-28STUDIES OF THE MECHANISM O
- Page 382 and 383:
OP-III-28и (iv) повторной
- Page 384 and 385:
OP-III-29При Т
- Page 386 and 387:
OP-III-30ACTIVE PHASE TRANSFORMATIO
- Page 388 and 389:
OP-III-30- Au, above 650° and for
- Page 390 and 391:
OP-III-31с участием раз
- Page 392 and 393:
OP-III-32- high-activity zone - in
- Page 394 and 395:
OP-III-33MATHEMATICAL MODEL OF THE
- Page 396 and 397:
OP-III-33a) b)Temperature [K]Pressu
- Page 398 and 399:
OP-III-34В настоящем со
- Page 400 and 401:
OP-III-35кластера имее
- Page 402 and 403:
OP-III-36APPLICATION OF MULTINUCLEA
- Page 404 and 405:
OP-III-36simultaneous occurrence of
- Page 406 and 407:
OP-III-37металлических
- Page 408 and 409:
OP-III-38METHODS FOR INVESTIGATION
- Page 410 and 411:
OP-III-39CIDNP IN ANALYSIS OF RADIC
- Page 412 and 413:
OP-III-39солей переход
- Page 414 and 415:
OP-III-40similar π-alkyne CpNi( Ph
- Page 416 and 417:
OP-III-41взаимодействи
- Page 419 and 420:
MECHANISM OF ARYLHALIDES CATALYTIC
- Page 421 and 422:
YP-1Из полученных да
- Page 423 and 424:
YP-2В развитие указа
- Page 425 and 426:
INVESTIGATION OF THE INFLUENCE OF C
- Page 427 and 428:
Таблица 1. Диаметр п
- Page 429 and 430:
YP-4При использовани
- Page 431 and 432:
YP-5В этой связи пред
- Page 433 and 434:
N-PENTANE ISOMERIZATION AT THE SUPE
- Page 435 and 436:
CYCLOHEXANOL CONVERTION OVER Cu-CON
- Page 437 and 438:
YP-7основных центров
- Page 439 and 440:
YP-8Разработана преп
- Page 441 and 442:
YP-9размер наночасти
- Page 443 and 444:
YP-10фольги очищалас
- Page 445 and 446:
YP-11STUDIES OF SELECTIVE HETEROGEN
- Page 447 and 448:
YP-11быстрее потенци
- Page 449 and 450:
YP-12водорода происх
- Page 451 and 452:
YP-13CATALYTIC ACTIVITY AND PHYSICO
- Page 453 and 454:
YP-13Hydrogen consumption [a.u.]543
- Page 455 and 456:
KS-I-6 Zemlyanov D., Aszalos-Kiss B
- Page 457 and 458:
OP-I-8 Magaev O.V., Fedotova M.P.,
- Page 459 and 460:
OP-I-30 Rozdyalovskaya T.A., Chudin
- Page 461 and 462:
OP-II-12 Lavrenov A.V., Duplyakin V
- Page 463 and 464:
OP-II-37 Балаев А.В., Гр
- Page 465 and 466:
OP-III-16 Beloshapkin S., Zemlianov
- Page 467 and 468:
OP-III-40 Saraev V.V., Kraikivskii
- Page 469:
VII РОССИЙСКАЯ КОНФЕ