

Climate change impacts and vulnerability in Europe 2016
document
document

Create successful ePaper yourself
Turn your PDF publications into a flip-book with our unique Google optimized e-Paper software.
<strong>Climate</strong> <strong>change</strong> <strong>impacts</strong> on environmental systems<br />
Projections: global mean sea level<br />
Currently, there are two ma<strong>in</strong> approaches to project<strong>in</strong>g<br />
future sea level. Process-based models represent the<br />
most important known physical processes explicitly,<br />
whereas empirical statistical models look at the<br />
relationship between temperature (or radiative forc<strong>in</strong>g)<br />
<strong>and</strong> sea level that has been observed <strong>in</strong> the past <strong>and</strong><br />
extrapolate it <strong>in</strong>to the future. A significant recent step<br />
forwards <strong>in</strong> project<strong>in</strong>g future sea levels is the improved<br />
underst<strong>and</strong><strong>in</strong>g of the contribut<strong>in</strong>g factors to recently<br />
observed sea level rise, which has <strong>in</strong>creased confidence<br />
<strong>in</strong> the use of process-based models for project<strong>in</strong>g the<br />
future (Church et al., 2013).<br />
The IPCC AR5 concludes that the rate of GMSL rise<br />
dur<strong>in</strong>g the 21st century will very likely exceed the rate<br />
observed <strong>in</strong> the period 1971–2010 for all emissions<br />
scenarios. Process-based models estimate the rise<br />
<strong>in</strong> GMSL for the period 2081–2100, compared with<br />
1986–2005, to be likely <strong>in</strong> the range of 0.26–0.54 m<br />
for RCP2.6, 0.32–0.62 m for RCP4.5, 0.33–0.62 m for<br />
RCP6.0 <strong>and</strong> 0.45–0.81 m for RCP8.5. For RCP8.5, the<br />
rise <strong>in</strong> GMSL by 2100 is projected to be <strong>in</strong> the range<br />
of 0.53–0.97 m, with a rate dur<strong>in</strong>g 2081–2100 of<br />
7–15 mm/year. Based on current underst<strong>and</strong><strong>in</strong>g, only<br />
a collapse of mar<strong>in</strong>e‐based sectors of the Antarctic Ice<br />
Sheet (i.e. those areas where the bed lies well below<br />
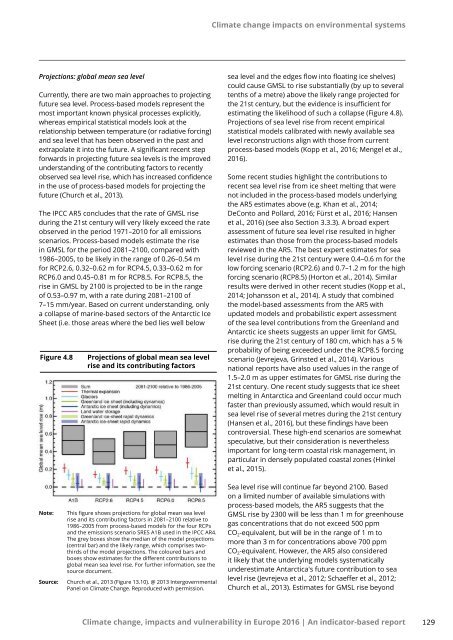
Figure 4.8<br />
Projections of global mean sea level<br />
rise <strong>and</strong> its contribut<strong>in</strong>g factors<br />
sea level <strong>and</strong> the edges flow <strong>in</strong>to float<strong>in</strong>g ice shelves)<br />
could cause GMSL to rise substantially (by up to several<br />
tenths of a metre) above the likely range projected for<br />
the 21st century, but the evidence is <strong>in</strong>sufficient for<br />
estimat<strong>in</strong>g the likelihood of such a collapse (Figure 4.8).<br />
Projections of sea level rise from recent empirical<br />
statistical models calibrated with newly available sea<br />
level reconstructions align with those from current<br />
process-based models (Kopp et al., <strong>2016</strong>; Mengel et al.,<br />
<strong>2016</strong>).<br />
Some recent studies highlight the contributions to<br />
recent sea level rise from ice sheet melt<strong>in</strong>g that were<br />
not <strong>in</strong>cluded <strong>in</strong> the process-based models underly<strong>in</strong>g<br />
the AR5 estimates above (e.g. Khan et al., 2014;<br />
DeConto <strong>and</strong> Pollard, <strong>2016</strong>; Fürst et al., <strong>2016</strong>; Hansen<br />
et al., <strong>2016</strong>) (see also Section 3.3.3). A broad expert<br />
assessment of future sea level rise resulted <strong>in</strong> higher<br />
estimates than those from the process-based models<br />
reviewed <strong>in</strong> the AR5. The best expert estimates for sea<br />
level rise dur<strong>in</strong>g the 21st century were 0.4–0.6 m for the<br />
low forc<strong>in</strong>g scenario (RCP2.6) <strong>and</strong> 0.7–1.2 m for the high<br />
forc<strong>in</strong>g scenario (RCP8.5) (Horton et al., 2014). Similar<br />
results were derived <strong>in</strong> other recent studies (Kopp et al.,<br />
2014; Johansson et al., 2014). A study that comb<strong>in</strong>ed<br />
the model-based assessments from the AR5 with<br />
updated models <strong>and</strong> probabilistic expert assessment<br />
of the sea level contributions from the Greenl<strong>and</strong> <strong>and</strong><br />
Antarctic ice sheets suggests an upper limit for GMSL<br />
rise dur<strong>in</strong>g the 21st century of 180 cm, which has a 5 %<br />
probability of be<strong>in</strong>g exceeded under the RCP8.5 forc<strong>in</strong>g<br />
scenario (Jevrejeva, Gr<strong>in</strong>sted et al., 2014). Various<br />
national reports have also used values <strong>in</strong> the range of<br />
1.5–2.0 m as upper estimates for GMSL rise dur<strong>in</strong>g the<br />
21st century. One recent study suggests that ice sheet<br />
melt<strong>in</strong>g <strong>in</strong> Antarctica <strong>and</strong> Greenl<strong>and</strong> could occur much<br />
faster than previously assumed, which would result <strong>in</strong><br />
sea level rise of several metres dur<strong>in</strong>g the 21st century<br />
(Hansen et al., <strong>2016</strong>), but these f<strong>in</strong>d<strong>in</strong>gs have been<br />
controversial. These high-end scenarios are somewhat<br />
speculative, but their consideration is nevertheless<br />
important for long‐term coastal risk management, <strong>in</strong><br />
particular <strong>in</strong> densely populated coastal zones (H<strong>in</strong>kel<br />
et al., 2015).<br />
Note:<br />
Source:<br />
This figure shows projections for global mean sea level<br />
rise <strong>and</strong> its contribut<strong>in</strong>g factors <strong>in</strong> 2081–2100 relative to<br />
1986–2005 from process-based models for the four RCPs<br />
<strong>and</strong> the emissions scenario SRES A1B used <strong>in</strong> the IPCC AR4.<br />
The grey boxes show the median of the model projections<br />
(central bar) <strong>and</strong> the likely range, which comprises twothirds<br />
of the model projections. The coloured bars <strong>and</strong><br />
boxes show estimates for the different contributions to<br />
global mean sea level rise. For further <strong>in</strong>formation, see the<br />
source document.<br />
Church et al., 2013 (Figure 13.10). @ 2013 Intergovernmental<br />
Panel on <strong>Climate</strong> Change. Reproduced with permission.<br />
Sea level rise will cont<strong>in</strong>ue far beyond 2100. Based<br />
on a limited number of available simulations with<br />
process-based models, the AR5 suggests that the<br />
GMSL rise by 2300 will be less than 1 m for greenhouse<br />
gas concentrations that do not exceed 500 ppm<br />
CO 2 ‐equivalent, but will be <strong>in</strong> the range of 1 m to<br />
more than 3 m for concentrations above 700 ppm<br />
CO 2 ‐equivalent. However, the AR5 also considered<br />
it likely that the underly<strong>in</strong>g models systematically<br />
underestimate Antarctica's future contribution to sea<br />
level rise (Jevrejeva et al., 2012; Schaeffer et al., 2012;<br />
Church et al., 2013). Estimates for GMSL rise beyond<br />
<strong>Climate</strong> <strong>change</strong>, <strong>impacts</strong> <strong>and</strong> <strong>vulnerability</strong> <strong>in</strong> <strong>Europe</strong> <strong>2016</strong> | An <strong>in</strong>dicator-based report<br />
129