

Climate change impacts and vulnerability in Europe 2016
document
document

Create successful ePaper yourself
Turn your PDF publications into a flip-book with our unique Google optimized e-Paper software.
<strong>Climate</strong> <strong>change</strong> <strong>impacts</strong> on society<br />
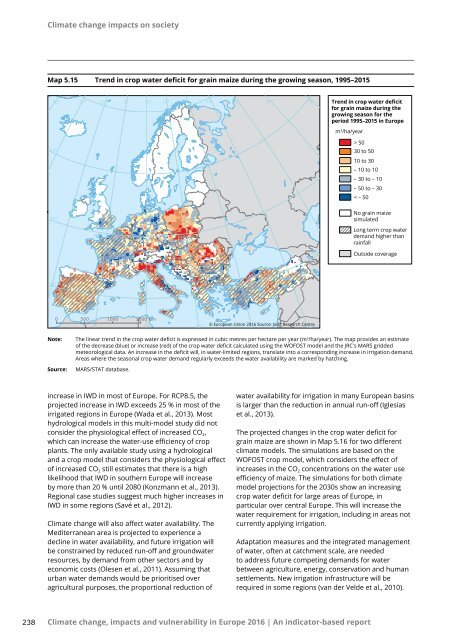
Map 5.15 Trend <strong>in</strong> crop water deficit for gra<strong>in</strong> maize dur<strong>in</strong>g the grow<strong>in</strong>g season, 1995–2015<br />
-30°<br />
-20°<br />
-10°<br />
0°<br />
10°<br />
20°<br />
30°<br />
40°<br />
50°<br />
60°<br />
70°<br />
Trend <strong>in</strong> crop water deficit<br />
for gra<strong>in</strong> maize dur<strong>in</strong>g the<br />
grow<strong>in</strong>g season for the<br />
period 1995–2015 <strong>in</strong> <strong>Europe</strong><br />
m 3 /ha/year<br />
> 50<br />
30 to 50<br />
10 to 30<br />
– 10 to 10<br />
– 30 to – 10<br />
– 50 to – 30<br />
< – 50<br />
60°<br />
50°<br />
50°<br />
No gra<strong>in</strong> maize<br />
simulated<br />
Long term crop water<br />
dem<strong>and</strong> higher than<br />
ra<strong>in</strong>fall<br />
40°<br />
Outside coverage<br />
40°<br />
0 500 1000 1500 km<br />
0°<br />
10°<br />
20°<br />
© <strong>Europe</strong>an Union <strong>2016</strong> 30° Source: Jo<strong>in</strong>t Research Centre 40°<br />
Note:<br />
Source:<br />
The l<strong>in</strong>ear trend <strong>in</strong> the crop water deficit is expressed <strong>in</strong> cubic metres per hectare per year (m 3 /ha/year). The map provides an estimate<br />
of the decrease (blue) or <strong>in</strong>crease (red) of the crop water deficit calculated us<strong>in</strong>g the WOFOST model <strong>and</strong> the JRC's MARS gridded<br />
meteorological data. An <strong>in</strong>crease <strong>in</strong> the deficit will, <strong>in</strong> water-limited regions, translate <strong>in</strong>to a correspond<strong>in</strong>g <strong>in</strong>crease <strong>in</strong> irrigation dem<strong>and</strong>.<br />
Areas where the seasonal crop water dem<strong>and</strong> regularly exceeds the water availability are marked by hatch<strong>in</strong>g.<br />
MARS/STAT database.<br />
<strong>in</strong>crease <strong>in</strong> IWD <strong>in</strong> most of <strong>Europe</strong>. For RCP8.5, the<br />
projected <strong>in</strong>crease <strong>in</strong> IWD exceeds 25 % <strong>in</strong> most of the<br />
irrigated regions <strong>in</strong> <strong>Europe</strong> (Wada et al., 2013). Most<br />
hydrological models <strong>in</strong> this multi‐model study did not<br />
consider the physiological effect of <strong>in</strong>creased CO 2 ,<br />
which can <strong>in</strong>crease the water-use efficiency of crop<br />
plants. The only available study us<strong>in</strong>g a hydrological<br />
<strong>and</strong> a crop model that considers the physiological effect<br />
of <strong>in</strong>creased CO 2 still estimates that there is a high<br />
likelihood that IWD <strong>in</strong> southern <strong>Europe</strong> will <strong>in</strong>crease<br />
by more than 20 % until 2080 (Konzmann et al., 2013).<br />
Regional case studies suggest much higher <strong>in</strong>creases <strong>in</strong><br />
IWD <strong>in</strong> some regions (Savé et al., 2012).<br />
<strong>Climate</strong> <strong>change</strong> will also affect water availability. The<br />
Mediterranean area is projected to experience a<br />
decl<strong>in</strong>e <strong>in</strong> water availability, <strong>and</strong> future irrigation will<br />
be constra<strong>in</strong>ed by reduced run-off <strong>and</strong> groundwater<br />
resources, by dem<strong>and</strong> from other sectors <strong>and</strong> by<br />
economic costs (Olesen et al., 2011). Assum<strong>in</strong>g that<br />
urban water dem<strong>and</strong>s would be prioritised over<br />
agricultural purposes, the proportional reduction of<br />
water availability for irrigation <strong>in</strong> many <strong>Europe</strong>an bas<strong>in</strong>s<br />
is larger than the reduction <strong>in</strong> annual run-off (Iglesias<br />
et al., 2013).<br />
The projected <strong>change</strong>s <strong>in</strong> the crop water deficit for<br />
gra<strong>in</strong> maize are shown <strong>in</strong> Map 5.16 for two different<br />
climate models. The simulations are based on the<br />
WOFOST crop model, which considers the effect of<br />
<strong>in</strong>creases <strong>in</strong> the CO 2 concentrations on the water use<br />
efficiency of maize. The simulations for both climate<br />
model projections for the 2030s show an <strong>in</strong>creas<strong>in</strong>g<br />
crop water deficit for large areas of <strong>Europe</strong>, <strong>in</strong><br />
particular over central <strong>Europe</strong>. This will <strong>in</strong>crease the<br />
water requirement for irrigation, <strong>in</strong>clud<strong>in</strong>g <strong>in</strong> areas not<br />
currently apply<strong>in</strong>g irrigation.<br />
Adaptation measures <strong>and</strong> the <strong>in</strong>tegrated management<br />
of water, often at catchment scale, are needed<br />
to address future compet<strong>in</strong>g dem<strong>and</strong>s for water<br />
between agriculture, energy, conservation <strong>and</strong> human<br />
settlements. New irrigation <strong>in</strong>frastructure will be<br />
required <strong>in</strong> some regions (van der Velde et al., 2010).<br />
238 <strong>Climate</strong> <strong>change</strong>, <strong>impacts</strong> <strong>and</strong> <strong>vulnerability</strong> <strong>in</strong> <strong>Europe</strong> <strong>2016</strong> | An <strong>in</strong>dicator-based report