- Page 1:
EEA Report No 1/2017 Climate change
- Page 4 and 5:
Cover design: EEA Cover photo: © J
- Page 6 and 7:
Contents 3 Changes in the climate s
- Page 8 and 9:
Contents 6 Multi-sectoral vulnerabi
- Page 10 and 11:
Acknowledgements Acknowledgements R
- Page 12 and 13:
Acknowledgements Chapter 6: Multi-s
- Page 14 and 15:
Executive summary Executive summary
- Page 16 and 17:
Executive summary ES.1 Introduction
- Page 18 and 19:
Executive summary EU climate policy
- Page 20 and 21:
Executive summary dispersal of inva
- Page 22 and 23:
Executive summary Human health The
- Page 24 and 25:
Executive summary Table ES.1 Key ob
- Page 26 and 27:
Executive summary For 34 out of the
- Page 28 and 29:
Executive summary precipitation, th
- Page 30 and 31:
Executive summary as a result of cl
- Page 32 and 33:
Executive summary thereby deliverin
- Page 34 and 35:
Introduction 1.1.2 Content and data
- Page 36 and 37:
Introduction 1.1.3 Changes compared
- Page 38 and 39:
Introduction Table 1.4 Overview of
- Page 40 and 41:
Introduction collaboration between
- Page 42 and 43:
Introduction The primary characteri
- Page 44 and 45:
Introduction Table 1.7 Data coverag
- Page 46 and 47:
Introduction 1.3 Uncertainty in obs
- Page 48 and 49:
Introduction • attribution of an
- Page 50 and 51:
Introduction Article 4.4 of the UNF
- Page 52 and 53:
Policy context 2 Policy context 2.1
- Page 54 and 55:
Policy context In addition, the 203
- Page 56 and 57:
Policy context EU Adaptation Strate
- Page 58 and 59:
Policy context Map 2.1 Overview of
- Page 60 and 61:
Policy context Baltic Marine Enviro
- Page 62 and 63:
Policy context includes recommendat
- Page 64 and 65:
Changes in the climate system Figur
- Page 66 and 67:
Changes in the climate system asses
- Page 68 and 69:
Changes in the climate system Box 3
- Page 70 and 71:
Changes in the climate system incre
- Page 72 and 73:
Changes in the climate system in Eu
- Page 74 and 75:
Changes in the climate system Box 3
- Page 76 and 77:
Changes in the climate system Figur
- Page 78 and 79:
Changes in the climate system Proje
- Page 80 and 81:
Changes in the climate system Map 3
- Page 82 and 83:
Changes in the climate system 3.2.4
- Page 84 and 85:
Changes in the climate system 3.2.5
- Page 86 and 87:
Changes in the climate system Map 3
- Page 88 and 89:
Changes in the climate system 1871-
- Page 90 and 91:
Changes in the climate system 3.2.7
- Page 92 and 93:
Changes in the climate system 3.3 C
- Page 94 and 95:
Changes in the climate system 3.3.2
- Page 96 and 97:
Changes in the climate system Figur
- Page 98 and 99:
Changes in the climate system 3.3.3
- Page 100 and 101:
Changes in the climate system the i
- Page 102 and 103:
Changes in the climate system Figur
- Page 104 and 105:
Changes in the climate system 3.3.5
- Page 106 and 107:
Changes in the climate system Proje
- Page 108 and 109:
Climate change impacts on environme
- Page 110 and 111:
Climate change impacts on environme
- Page 112 and 113:
Climate change impacts on environme
- Page 114 and 115:
Climate change impacts on environme
- Page 116 and 117:
Climate change impacts on environme
- Page 118 and 119:
Climate change impacts on environme
- Page 120 and 121:
Climate change impacts on environme
- Page 122 and 123:
Climate change impacts on environme
- Page 124 and 125:
Climate change impacts on environme
- Page 126 and 127:
Climate change impacts on environme
- Page 128 and 129:
Climate change impacts on environme
- Page 130 and 131:
Climate change impacts on environme
- Page 132 and 133:
Climate change impacts on environme
- Page 134 and 135:
Climate change impacts on environme
- Page 136 and 137:
Climate change impacts on environme
- Page 138 and 139:
Climate change impacts on environme
- Page 140 and 141:
Climate change impacts on environme
- Page 142 and 143:
Climate change impacts on environme
- Page 144 and 145:
Climate change impacts on environme
- Page 146 and 147:
Climate change impacts on environme
- Page 148 and 149:
Climate change impacts on environme
- Page 150 and 151:
Climate change impacts on environme
- Page 152 and 153:
Climate change impacts on environme
- Page 154 and 155:
Climate change impacts on environme
- Page 156 and 157:
Climate change impacts on environme
- Page 158 and 159:
Climate change impacts on environme
- Page 160 and 161:
Climate change impacts on environme
- Page 162 and 163:
Climate change impacts on environme
- Page 164 and 165:
Climate change impacts on environme
- Page 166 and 167:
Climate change impacts on environme
- Page 168 and 169:
Climate change impacts on environme
- Page 170 and 171:
Climate change impacts on environme
- Page 172 and 173:
Climate change impacts on environme
- Page 174 and 175:
Climate change impacts on environme
- Page 176 and 177:
Climate change impacts on environme
- Page 178 and 179:
Climate change impacts on environme
- Page 180 and 181:
Climate change impacts on environme
- Page 182 and 183:
Climate change impacts on environme
- Page 184 and 185:
Climate change impacts on environme
- Page 186 and 187: Climate change impacts on environme
- Page 188 and 189: Climate change impacts on environme
- Page 190 and 191: Climate change impacts on environme
- Page 192 and 193: Climate change impacts on society 5
- Page 194 and 195: Climate change impacts on society 5
- Page 196 and 197: Climate change impacts on society F
- Page 198 and 199: Climate change impacts on society a
- Page 200 and 201: Climate change impacts on society F
- Page 202 and 203: Climate change impacts on society F
- Page 204 and 205: Climate change impacts on society h
- Page 206 and 207: Climate change impacts on society H
- Page 208 and 209: Climate change impacts on society M
- Page 210 and 211: Climate change impacts on society w
- Page 212 and 213: Climate change impacts on society p
- Page 214 and 215: Climate change impacts on society b
- Page 216 and 217: Climate change impacts on society M
- Page 218 and 219: Climate change impacts on society c
- Page 220 and 221: Climate change impacts on society M
- Page 222 and 223: Climate change impacts on society T
- Page 224 and 225: Climate change impacts on society o
- Page 226 and 227: Climate change impacts on society t
- Page 228 and 229: Climate change impacts on society B
- Page 230 and 231: Climate change impacts on society 5
- Page 232 and 233: Climate change impacts on society 5
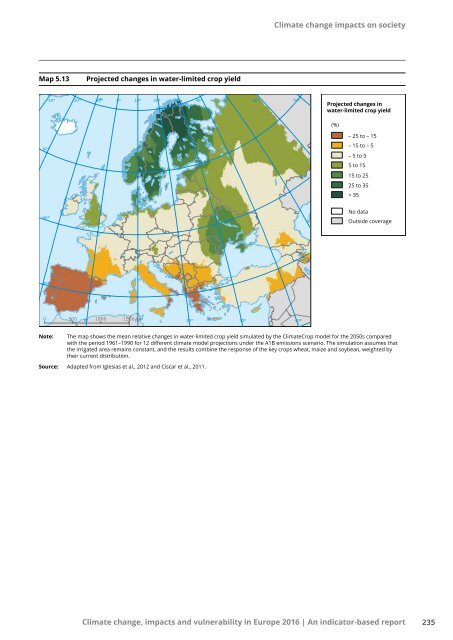
- Page 234 and 235: Climate change impacts on society 5
- Page 238 and 239: Climate change impacts on society M
- Page 240 and 241: Climate change impacts on society M
- Page 242 and 243: Climate change impacts on society 5
- Page 244 and 245: Climate change impacts on society T
- Page 246 and 247: Climate change impacts on society 5
- Page 248 and 249: Climate change impacts on society 5
- Page 250 and 251: Climate change impacts on society M
- Page 252 and 253: Climate change impacts on society T
- Page 254 and 255: Climate change impacts on society p
- Page 256 and 257: Climate change impacts on society 5
- Page 258 and 259: Climate change impacts on society u
- Page 260 and 261: Climate change impacts on society T
- Page 262 and 263: Climate change impacts on society 5
- Page 264 and 265: Climate change impacts on society r
- Page 266 and 267: Climate change impacts on society 5
- Page 268 and 269: Climate change impacts on society 5
- Page 270 and 271: Multi-sectoral vulnerability and ri
- Page 272 and 273: Multi-sectoral vulnerability and ri
- Page 274 and 275: Multi-sectoral vulnerability and ri
- Page 276 and 277: Multi-sectoral vulnerability and ri
- Page 278 and 279: Multi-sectoral vulnerability and ri
- Page 280 and 281: Multi-sectoral vulnerability and ri
- Page 282 and 283: Multi-sectoral vulnerability and ri
- Page 284 and 285: Multi-sectoral vulnerability and ri
- Page 286 and 287:
Multi-sectoral vulnerability and ri
- Page 288 and 289:
Multi-sectoral vulnerability and ri
- Page 290 and 291:
Multi-sectoral vulnerability and ri
- Page 292 and 293:
Multi-sectoral vulnerability and ri
- Page 294 and 295:
Multi-sectoral vulnerability and ri
- Page 296 and 297:
Multi-sectoral vulnerability and ri
- Page 298 and 299:
Multi-sectoral vulnerability and ri
- Page 300 and 301:
Multi-sectoral vulnerability and ri
- Page 302 and 303:
Multi-sectoral vulnerability and ri
- Page 304 and 305:
Multi-sectoral vulnerability and ri
- Page 306 and 307:
Multi-sectoral vulnerability and ri
- Page 308 and 309:
Multi-sectoral vulnerability and ri
- Page 310 and 311:
Multi-sectoral vulnerability and ri
- Page 312 and 313:
Multi-sectoral vulnerability and ri
- Page 314 and 315:
Strengthening the knowledge base 7
- Page 316 and 317:
Strengthening the knowledge base nu
- Page 318 and 319:
Strengthening the knowledge base Th
- Page 320 and 321:
Strengthening the knowledge base Re
- Page 322 and 323:
Strengthening the knowledge base me
- Page 324 and 325:
Strengthening the knowledge base Re
- Page 326 and 327:
Strengthening the knowledge base
- Page 328 and 329:
Abbreviations and acronyms 8 Abbrev
- Page 330 and 331:
Abbreviations and acronyms Table 8.
- Page 332 and 333:
Abbreviations and acronyms Table 8.
- Page 334 and 335:
Abbreviations and acronyms 8.2 Acro
- Page 336 and 337:
References References Executive sum
- Page 338 and 339:
References EEA, 2004, Impacts of Eu
- Page 340 and 341:
References Adaptation to Climate Ch
- Page 342 and 343:
References EEA, 2015a, National mon
- Page 344 and 345:
References high-resolution climate
- Page 346 and 347:
References Fischer, E. M., Sedláč
- Page 348 and 349:
References Geophysical Research Let
- Page 350 and 351:
References Barletta, V. R., Sørens
- Page 352 and 353:
References Discussions 15(14), 20 0
- Page 354 and 355:
References Palm, S. P., Strey, S. T
- Page 356 and 357:
References L. R., Delgado Granados,
- Page 358 and 359:
References Chust, G., Allen, J. I.,
- Page 360 and 361:
References antropogent karbon i de
- Page 362 and 363:
References face of climate change',
- Page 364 and 365:
References Gerritsen, H., 2005, 'Wh
- Page 366 and 367:
References Andersen, K. K. and Chri
- Page 368 and 369:
References EEA, 2012b, Towards effi
- Page 370 and 371:
References Naturwissenschaften Schw
- Page 372 and 373:
References Arneth, A., Harrison, S.
- Page 374 and 375:
References northern margin of its d
- Page 376 and 377:
References Hegland, S. J., Nielsen,
- Page 378 and 379:
References weather', Agricultural a
- Page 380 and 381:
References 'The new assessment of s
- Page 382 and 383:
References Schweiger, O., Settele,
- Page 384 and 385:
References 'Warming experiments und
- Page 386 and 387:
References Forzieri, G., Bianchi, A
- Page 388 and 389:
References Burkart, K., Canário, P
- Page 390 and 391:
References Gertler, M., Durr, M., R
- Page 392 and 393:
References the environmental condit
- Page 394 and 395:
References Semenza, J. C., Sudre, B
- Page 396 and 397:
References Brisson, N., Gate, P., G
- Page 398 and 399:
References Lesk, C., Rowhani, P. an
- Page 400 and 401:
References Vitali, A., Segnalini, M
- Page 402 and 403:
References Rübbelke, D. and Vögel
- Page 404 and 405:
References Nemry, F. and Demirel, H
- Page 406 and 407:
References Pons, M., López-Moreno,
- Page 408 and 409:
References indicators of impacts an
- Page 410 and 411:
References Roudier, P., Andersson,
- Page 412 and 413:
References Global Environmental Cha
- Page 414 and 415:
References Chierici, M. and Fransso
- Page 416 and 417:
References the Pyrenees from a set
- Page 418 and 419:
References change on olive crop eva
- Page 420 and 421:
References Steeneveld, G. J., Koopm
- Page 423 and 424:
European Environment Agency Climate