

Climate change impacts and vulnerability in Europe 2016
document
document

Create successful ePaper yourself
Turn your PDF publications into a flip-book with our unique Google optimized e-Paper software.
Changes <strong>in</strong> the climate system<br />
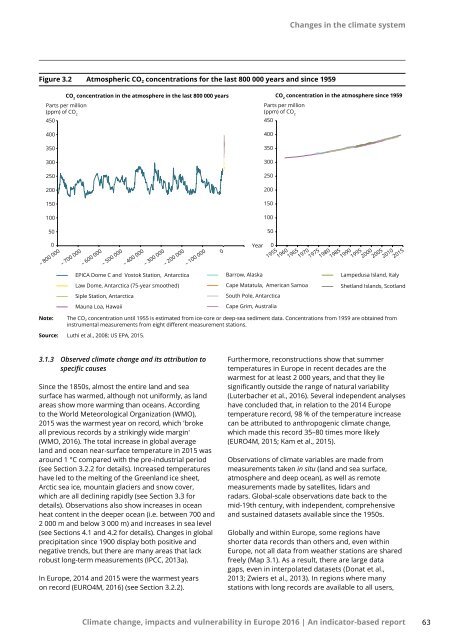
Figure 3.2 Atmospheric CO 2 concentrations for the last 800 000 years <strong>and</strong> s<strong>in</strong>ce 1959<br />
CO 2<br />
concentration <strong>in</strong> the atmosphere <strong>in</strong> the last 800 000 years<br />
Parts per million<br />
(ppm) of CO 2<br />
450<br />
400<br />
350<br />
300<br />
250<br />
200<br />
150<br />
Parts per million<br />
(ppm) of CO 2<br />
450<br />
400<br />
350<br />
300<br />
250<br />
200<br />
150<br />
CO 2<br />
concentration <strong>in</strong> the atmosphere s<strong>in</strong>ce 1959<br />
100<br />
50<br />
0<br />
– 800 000<br />
– 700 000<br />
– 600 000<br />
– 500 000<br />
– 400 000<br />
– 300 000<br />
– 200 000<br />
EPICA Dome C <strong>and</strong> Vostok Station, Antarctica<br />
Law Dome, Antarctica (75-year smoothed)<br />
Siple Station, Antarctica<br />
Mauna Loa, Hawaii<br />
– 100 000<br />
0<br />
Year<br />
Barrow, Alaska<br />
100<br />
50<br />
Cape Matatula, American Samoa<br />
0<br />
South Pole, Antarctica<br />
Cape Grim, Australia<br />
1955<br />
1960<br />
1965<br />
1970<br />
1975<br />
1980<br />
1985<br />
1990<br />
1995<br />
2000<br />
2005<br />
2010<br />
2015<br />
Lampedusa Isl<strong>and</strong>, Italy<br />
Shetl<strong>and</strong> Isl<strong>and</strong>s, Scotl<strong>and</strong><br />
Note:<br />
The CO 2 concentration until 1955 is estimated from ice-core or deep-sea sediment data. Concentrations from 1959 are obta<strong>in</strong>ed from<br />
<strong>in</strong>strumental measurements from eight different measurement stations.<br />
Source: Luthi et al., 2008; US EPA, 2015.<br />
3.1.3 Observed climate <strong>change</strong> <strong>and</strong> its attribution to<br />
specific causes<br />
S<strong>in</strong>ce the 1850s, almost the entire l<strong>and</strong> <strong>and</strong> sea<br />
surface has warmed, although not uniformly, as l<strong>and</strong><br />
areas show more warm<strong>in</strong>g than oceans. Accord<strong>in</strong>g<br />
to the World Meteorological Organization (WMO),<br />
2015 was the warmest year on record, which 'broke<br />
all previous records by a strik<strong>in</strong>gly wide marg<strong>in</strong>'<br />
(WMO, <strong>2016</strong>). The total <strong>in</strong>crease <strong>in</strong> global average<br />
l<strong>and</strong> <strong>and</strong> ocean near-surface temperature <strong>in</strong> 2015 was<br />
around 1 °C compared with the pre-<strong>in</strong>dustrial period<br />
(see Section 3.2.2 for details). Increased temperatures<br />
have led to the melt<strong>in</strong>g of the Greenl<strong>and</strong> ice sheet,<br />
Arctic sea ice, mounta<strong>in</strong> glaciers <strong>and</strong> snow cover,<br />
which are all decl<strong>in</strong><strong>in</strong>g rapidly (see Section 3.3 for<br />
details). Observations also show <strong>in</strong>creases <strong>in</strong> ocean<br />
heat content <strong>in</strong> the deeper ocean (i.e. between 700 <strong>and</strong><br />
2 000 m <strong>and</strong> below 3 000 m) <strong>and</strong> <strong>in</strong>creases <strong>in</strong> sea level<br />
(see Sections 4.1 <strong>and</strong> 4.2 for details). Changes <strong>in</strong> global<br />
precipitation s<strong>in</strong>ce 1900 display both positive <strong>and</strong><br />
negative trends, but there are many areas that lack<br />
robust long-term measurements (IPCC, 2013a).<br />
In <strong>Europe</strong>, 2014 <strong>and</strong> 2015 were the warmest years<br />
on record (EURO4M, <strong>2016</strong>) (see Section 3.2.2).<br />
Furthermore, reconstructions show that summer<br />
temperatures <strong>in</strong> <strong>Europe</strong> <strong>in</strong> recent decades are the<br />
warmest for at least 2 000 years, <strong>and</strong> that they lie<br />
significantly outside the range of natural variability<br />
(Luterbacher et al., <strong>2016</strong>). Several <strong>in</strong>dependent analyses<br />
have concluded that, <strong>in</strong> relation to the 2014 <strong>Europe</strong><br />
temperature record, 98 % of the temperature <strong>in</strong>crease<br />
can be attributed to anthropogenic climate <strong>change</strong>,<br />
which made this record 35–80 times more likely<br />
(EURO4M, 2015; Kam et al., 2015).<br />
Observations of climate variables are made from<br />
measurements taken <strong>in</strong> situ (l<strong>and</strong> <strong>and</strong> sea surface,<br />
atmosphere <strong>and</strong> deep ocean), as well as remote<br />
measurements made by satellites, lidars <strong>and</strong><br />
radars. Global-scale observations date back to the<br />
mid‐19th century, with <strong>in</strong>dependent, comprehensive<br />
<strong>and</strong> susta<strong>in</strong>ed datasets available s<strong>in</strong>ce the 1950s.<br />
Globally <strong>and</strong> with<strong>in</strong> <strong>Europe</strong>, some regions have<br />
shorter data records than others <strong>and</strong>, even with<strong>in</strong><br />
<strong>Europe</strong>, not all data from weather stations are shared<br />
freely (Map 3.1). As a result, there are large data<br />
gaps, even <strong>in</strong> <strong>in</strong>terpolated datasets (Donat et al.,<br />
2013; Zwiers et al., 2013). In regions where many<br />
stations with long records are available to all users,<br />
<strong>Climate</strong> <strong>change</strong>, <strong>impacts</strong> <strong>and</strong> <strong>vulnerability</strong> <strong>in</strong> <strong>Europe</strong> <strong>2016</strong> | An <strong>in</strong>dicator-based report<br />
63