- Page 1 and 2:
Indicadores de sostenibilidad de la
- Page 3 and 4:
Índice de abreviaturas ARC: Agricu
- Page 5 and 6:
4.2.6 PÉRDIDAS DE SUELO ..........
- Page 7 and 8:
Gráfico 34. Evolución de los Kg d
- Page 9 and 10:
Gráfico 108. Evolución en el cons
- Page 11 and 12:
Gráfico 184. Indicador directo de
- Page 13 and 14:
Gráfico 255. Indicadores indirecto
- Page 15 and 16:
Gráfico 313. Evolución del indica
- Page 17 and 18:
Índice de tablas Tabla 1. Evoluci
- Page 19 and 20:
Tabla 39. Evolución de los € de
- Page 21 and 22:
Índice de figuras Figura 1. Esquem
- Page 23 and 24:
forma similar a los indicadores con
- Page 25 and 26:
vegetales, los indicadores relativo
- Page 27 and 28:
El descenso del valor de la producc
- Page 29 and 30:
2.2 INDICADORES AGRÍCOLAS 2.2.1 RE
- Page 31 and 32:
Gráfico 3. Indicadores físicos de
- Page 33 and 34:
Gráfico 7. Indicadores físicos de
- Page 35 and 36:
Gráfico 11. Indicadores físicos d
- Page 37 and 38:
Gráfico 15. Indicadores físicos d
- Page 39 and 40:
Gráfico 19. Indicadores físicos d
- Page 41 and 42:
Gráfico 23. Indicadores físicos d
- Page 43 and 44:
Gráfico 27. Indicadores físicos d
- Page 45 and 46:
Gráfico 31. Indicadores físicos d
- Page 47 and 48:
estabilización o por ligeros desce
- Page 49 and 50:
de emisiones de gases contaminantes
- Page 51 and 52: compensatorios, se liberaliza la to
- Page 53 and 54: estiércol (y por tanto de emisione
- Page 55 and 56: 3 EXTENSIONES DEL ESTUDIO 3.1 ECONO
- Page 57 and 58: Directa: o Energía para el riego o
- Page 59 and 60: 4 METODOLOGÍA, FUENTES DE DATOS Y
- Page 61 and 62: Las modificaciones más importantes
- Page 63 and 64: Gráfico 37. Producción Final Agra
- Page 65 and 66: La evolución de la RA es creciente
- Page 67 and 68: Gráfico 42. Trabajo en la agricult
- Page 69 and 70: Gráfico 44. Relación Renta Agrari
- Page 71 and 72: Gráfico 47. Tonelada empleada de P
- Page 73 and 74: Gráfico 48. Evolución del IPP e I
- Page 75 and 76: Gráfico 48c. Evolución del IPP e
- Page 77 and 78: Gráfico 50. Evolución del IPP e I
- Page 79 and 80: Gráfico 52. Evolución del IPP e I
- Page 81 and 82: Gráfico 54. Evolución del IPP e I
- Page 83 and 84: Gráfico 56. Evolución del IPP e I
- Page 85 and 86: Ministerio de Agricultura, Pesca y
- Page 87 and 88: 1/A1: Hectáreas para obtener una t
- Page 89 and 90: Gráfico 61. Evolución del rendimi
- Page 91 and 92: Gráfico 65. Evolución del rendimi
- Page 93 and 94: Gráfico 69. Evolución del rendimi
- Page 95 and 96: Gráfico 73. Evolución del rendimi
- Page 97 and 98: Gráfico 77. Evolución del rendimi
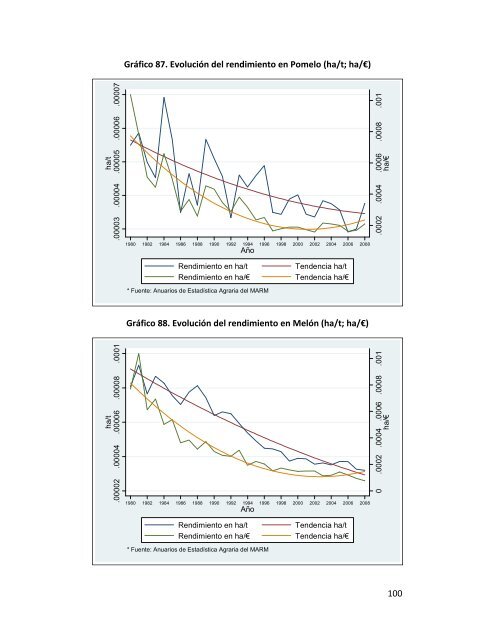
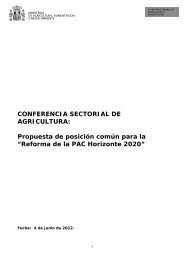
- Page 99 and 100: Gráfico 81. Evolución del rendimi
- Page 101: Gráfico 85. Evolución del rendimi
- Page 105 and 106: 4.2.2 USO DEL AGUA 4.2.2.1 OBJETIVO
- Page 107 and 108: p ( mm eff ) = 0,8 × p − 25 , si
- Page 109 and 110: Figura 5: Esquema del procedimiento
- Page 111 and 112: Gráfico 90. Evolución en el consu
- Page 113 and 114: Gráfico 94. Evolución en el consu
- Page 115 and 116: Gráfico 98. Evolución en el consu
- Page 117 and 118: Gráfico 102. Evolución en el cons
- Page 119 and 120: Gráfico 106. Evolución en el cons
- Page 121 and 122: Gráfico 110. Evolución en el cons
- Page 123 and 124: Gráfico 114. Evolución en el cons
- Page 125 and 126: Gráfico 118. Evolución en el cons
- Page 127 and 128: Gráfico 122. Evolución en el cons
- Page 129 and 130: Gráfico 126. Evolución en el cons
- Page 131 and 132: Gráfico 130. Evolución en el cons
- Page 133 and 134: Gráfico 134. Evolución en el cons
- Page 135 and 136: Gráfico 138. Evolución en el cons
- Page 137 and 138: Gráfico 142. Evolución en el cons
- Page 139 and 140: Gráfico 146. Evolución en el cons
- Page 141 and 142: Gráfico 150. Evolución en el cons
- Page 143 and 144: 4.2.2.4 CONCLUSIONES En los indicad
- Page 145 and 146: combustible agrícola, cuyo cálcul
- Page 147 and 148: Gráfico 154. Indicador directo de
- Page 149 and 150: Gráfico 158. Indicador directo de
- Page 151 and 152: Gráfico 162. Indicador directo de
- Page 153 and 154:
Gráfico 166. Indicador directo de
- Page 155 and 156:
Gráfico 170. Indicador directo de
- Page 157 and 158:
Gráfico 174. Indicador directo de
- Page 159 and 160:
Gráfico 178. Indicador directo de
- Page 161 and 162:
Gráfico 182. Indicador directo de
- Page 163 and 164:
4.2.3.4 CONCLUSIONES De los resulta
- Page 165 and 166:
4.2.4 ENERGÍA 4.2.4.1 OBJETIVOS El
- Page 167 and 168:
4.2.4.2.1.2 “Método de estimaci
- Page 169 and 170:
La Figura 2 presenta esquemáticame
- Page 171 and 172:
Figura 3. Esquema general de los c
- Page 173 and 174:
La Figura 4 presenta los valores de
- Page 175 and 176:
El esquema de trabajo, Figura 6, pa
- Page 177 and 178:
C sup (L/ha) = T op (h/ha) * C h (L
- Page 179 and 180:
Arrancadora de Remolacha 8,00 Carga
- Page 181 and 182:
4.2.4.2.3.2 Cálculos realizados: A
- Page 183 and 184:
Gráfico 186. Consumo superficial d
- Page 185 and 186:
Con los recientes cambios que se es
- Page 187 and 188:
Gráfico 189. Indicadores directos
- Page 189 and 190:
Gráfico 193. Indicadores directos
- Page 191 and 192:
Gráfico 197. Indicadores directos
- Page 193 and 194:
Gráfico 201. Indicadores directos
- Page 195 and 196:
Gráfico 205. Indicadores directos
- Page 197 and 198:
Gráfico 209. Indicadores directos
- Page 199 and 200:
Gráfico 213. Indicadores directos
- Page 201 and 202:
Gráfico 217. Indicadores directos
- Page 203 and 204:
4.2.4.4 CONCLUSIONES De los resulta
- Page 205 and 206:
Gráfico 222. Evolución del valor
- Page 207 and 208:
4.2.6 PÉRDIDAS DE SUELO 4.2.6.1 OB
- Page 209 and 210:
4.2.6.2.1 Antecedentes. La principa
- Page 211 and 212:
fecha en la que se prevé su finali
- Page 213 and 214:
Tabla 11. Superficie geográfica y
- Page 215 and 216:
Gráfico 224. Pérdidas de suelo po
- Page 217 and 218:
Tabla 15. Clasificación de las sup
- Page 219 and 220:
A continuación se muestran los res
- Page 221 and 222:
Gráfico 228. Indicadores directos
- Page 223 and 224:
Gráfico 232. Indicadores directos
- Page 225 and 226:
Gráfico 236. Indicadores directos
- Page 227 and 228:
Gráfico 240. Indicadores directos
- Page 229 and 230:
Gráfico 244. Indicadores directos
- Page 231 and 232:
Gráfico 248. Indicadores directos
- Page 233 and 234:
Gráfico 252. Indicadores directos
- Page 235 and 236:
Gráfico 256. Indicadores directos
- Page 237 and 238:
4.2.6.5 BIBLIOGRAFÍA European Envi
- Page 239 and 240:
ABS: Carbono captado o absorbido. E
- Page 241 and 242:
consumo de combustible empleado en
- Page 243 and 244:
A continuación, se muestran de for
- Page 245 and 246:
Gráfico 260. Indicadores directos
- Page 247 and 248:
Gráfico 264. Indicadores directos
- Page 249 and 250:
Gráfico 268. Indicadores directos
- Page 251 and 252:
Gráfico 272. Indicadores directos
- Page 253 and 254:
Gráfico 276. Indicadores directos
- Page 255 and 256:
Gráfico 280. Indicadores directos
- Page 257 and 258:
Gráfico 284. Indicadores directos
- Page 259 and 260:
Gráfico 288. Indicadores directos
- Page 261 and 262:
Paustian, K.; Andrén, O.; Janzen,
- Page 263 and 264:
“Según la fase de producción co
- Page 265 and 266:
destina a la producción de piensos
- Page 267 and 268:
Ecuación 54. Cálculo para la obte
- Page 269 and 270:
Tabla 18. Estimaciones de consumo d
- Page 271 and 272:
Tabla 20. Recomendaciones del Grupo
- Page 273 and 274:
Tabla 22. Estimación y evolución
- Page 275 and 276:
En la Tabla 24, se muestran los val
- Page 277 and 278:
Gráfico 292. Evolución de la prod
- Page 279 and 280:
Tabla 26. Evolución de los € de
- Page 281 and 282:
Gráfico 295. Evolución del indica
- Page 283 and 284:
Tabla 27. Estimaciones del consumo
- Page 285 and 286:
Tabla 29. Recomendaciones del Grupo
- Page 287 and 288:
Tabla 31. Estimación y evolución
- Page 289 and 290:
La Tabla 33, muestra la evolución
- Page 291 and 292:
Gráfico 299. Evolución de los Kg
- Page 293 and 294:
Para la obtención de estos dos nue
- Page 295 and 296:
Gráfico 301. Evolución del indica
- Page 297 and 298:
En el Gráfico 300 y en el Gráfico
- Page 299 and 300:
Gráfico 304. Evolución del censo
- Page 301 and 302:
Tabla 38. Evolución de los indicad
- Page 303 and 304:
Gráfico 307. Evolución del indica
- Page 305 and 306:
En los indicadores del Gráfico 307
- Page 307 and 308:
4.3.1.6 BIBLIOGRAFÍA Austic, R., N
- Page 309 and 310:
Ministry of Environment. 1996. Anim
- Page 311 and 312:
4.3.2 EVOLUCIÓN DE LAS EMISIONES D
- Page 313 and 314:
4.3.2.2 OBJETIVOS Se ha realizado u
- Page 315 and 316:
Figura 16. Explicación esquemátic
- Page 317 and 318:
4.3.2.4 RESULTADOS (EN PORCINO Y AV
- Page 319 and 320:
Tabla 43. Evolución de las cantida
- Page 321 and 322:
Gráfico 311. Evolución del indica
- Page 323 and 324:
Gráfico 315. Evolución del indica
- Page 325 and 326:
Tabla 45. Evolución de las cantida
- Page 327 and 328:
Tabla 47. Evolución de las cantida
- Page 329 and 330:
Tabla 49. Evolución de los indicad
- Page 331 and 332:
Gráfico 319. Evolución del indica
- Page 333 and 334:
Gráfico 323. Evolución del indica
- Page 335 and 336:
Tabla 50. Evolución y resultados d
- Page 337 and 338:
Gráfico 325. Evolución del indica
- Page 339 and 340:
Tabla 52. Evolución de las cantida
- Page 341 and 342:
Tabla 54. Evolución de las cantida
- Page 343 and 344:
Tabla 56. Evolución de los indicad
- Page 345 and 346:
Gráfico 329. Evolución del indica
- Page 347 and 348:
Gráfico 333. Evolución del indica
- Page 349 and 350:
Tabla 57. Evolución y resultados d
- Page 351 and 352:
Gráfico 335 Evolución del indicad
- Page 353 and 354:
Tabla 60. Evolución de las cantida
- Page 355 and 356:
En la Tabla 62, se observan los res
- Page 357 and 358:
Tabla 63. Valores referentes a los
- Page 359 and 360:
Gráfico 339. Evolución del indica
- Page 361 and 362:
Gráfico 343. Evolución del indica
- Page 363 and 364:
4.3.2.5 CONCLUSIONES Las emisiones
- Page 365 and 366:
4.3.2.6 BIBLIOGRAFÍA Chatellier, V
- Page 367 and 368:
MIEMBROS DE LA PLATAFORMA TECNOLÓG