Indicadores de sostenibilidad de la agricultura y ganaderÃa españolas
Indicadores de sostenibilidad de la agricultura y ganaderÃa españolas
Indicadores de sostenibilidad de la agricultura y ganaderÃa españolas

Create successful ePaper yourself
Turn your PDF publications into a flip-book with our unique Google optimized e-Paper software.
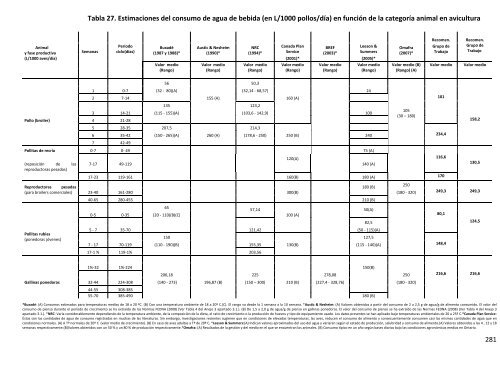
Tab<strong>la</strong> 27. Estimaciones <strong>de</strong>l consumo <strong>de</strong> agua <strong>de</strong> bebida (en L/1000 pollos/día) en función <strong>de</strong> <strong>la</strong> categoría animal en avicultura<br />
Animal<br />
y fase productiva<br />
(L/1000 aves/día)<br />
Semanas<br />
Periodo<br />
ciclo(días)<br />
Buxadé<br />
(1987 y 1988)*<br />
Valor medio<br />
(Rango)<br />
Austic & Nesheim<br />
(1990)*<br />
Valor medio<br />
(Rango)<br />
NRC<br />
(1994)*<br />
Valor medio<br />
(Rango)<br />
Canada P<strong>la</strong>n BREF<br />
Leeson &<br />
Service<br />
(2003)*<br />
Summers<br />
(2001)* (2005)*<br />
Valor medio<br />
(Rango)<br />
Valor medio<br />
(Rango)<br />
Valor medio<br />
(Rango)<br />
Omafra<br />
(2007)*<br />
Valor medio (B)<br />
(Rango) (A)<br />
Recomen.<br />
Grupo <strong>de</strong><br />
Trabajo<br />
Valor medio<br />
Recomen.<br />
Grupo <strong>de</strong><br />
Trabajo<br />
Valor medio<br />
56 50,3<br />
1 0‐7<br />
(32 ‐ 80)(A) (32,14 ‐ 68,57)<br />
24<br />
2 7‐14 155 (A) 160 (A) 101<br />
135 123,2<br />
105<br />
3 14‐21<br />
(115 ‐ 155)(A) (103,6 ‐ 142,9)<br />
100<br />
(30 – 180)<br />
Pollo (broiler) 4 21‐28 158,2<br />
5 28‐35 207,5 214,3<br />
6 35‐42 (150 ‐ 265)(A) 260 (A) (178,6 ‐ 250) 250 (B) 240 234,4<br />
7 42‐49<br />
Pollitas <strong>de</strong> recría 0‐7 0‐ 49<br />
75 (A)<br />
120(A)<br />
116,6<br />
(reposición <strong>de</strong> <strong>la</strong>s 7‐17 49‐119 140 (A)<br />
130,5<br />
reproductoras pesadas)<br />
17‐23 119‐161 160(B) 180 (A) 170<br />
Reproductoras pesadas<br />
180 (B)<br />
250<br />
(para broilers comerciales) 23‐40 161‐280 300(B)<br />
(180 ‐ 320) 249,3 249,3<br />
40‐65 280‐455 210 (B)<br />
65<br />
57,14<br />
0‐5 0‐35<br />
(20 ‐ 110)(B)(C) 100 (A)<br />
50(A)<br />
80,1<br />
82,5 124,5<br />
5 ‐ 7 35‐70 121,42<br />
(50 ‐ 115)(A)<br />
Pollitas rubias<br />
(ponedoras jóvenes)<br />
150<br />
127,5<br />
7 ‐ 17 70‐119<br />
(110 ‐ 190)(B) 155,35 130(B)<br />
(115 ‐ 140)(A) 148,4<br />
17‐1 % 119‐1% 203,56<br />
1%‐32 1%‐224<br />
150(B)<br />
206,18<br />
225<br />
278,08 250 216,6 216,6<br />
Gallinas ponedoras 32‐44 224‐308<br />
(140 ‐ 273) 196,87 (B)<br />
(150 – 300) 210 (B) (227,4 ‐ 328,76) (180 ‐ 320)<br />
44‐55 308‐385<br />
55‐70 385‐490 180 (B)<br />
*Buxadé: (A) Consumos estimados para temperaturas medias <strong>de</strong> 18 a 20 ºC. (B) Con una temperatura ambiente <strong>de</strong> 18 a 20º C.(C). El rango va <strong>de</strong>s<strong>de</strong> <strong>la</strong> 1 semana a <strong>la</strong> 10 semana. *Austic & Nesheim: (A) Valores obtenidos a partir <strong>de</strong>l consumo <strong>de</strong> 2 a 2,5 g <strong>de</strong> agua/g <strong>de</strong> alimento consumido. El valor <strong>de</strong>l<br />
consumo <strong>de</strong> pienso durante el período <strong>de</strong> crecimiento se ha extraído <strong>de</strong> <strong>la</strong>s Normas FEDNA (2008) (Ver Tab<strong>la</strong> 4 <strong>de</strong>l Anejo 3 apartado 3.1.). (B) De 1,5 a 2,0 g <strong>de</strong> agua/g <strong>de</strong> pienso en gallinas ponedoras. El valor <strong>de</strong>l consumo <strong>de</strong> pienso se ha extraído <strong>de</strong> <strong>la</strong>s Normas FEDNA (2008) (Ver Tab<strong>la</strong> 4 <strong>de</strong>l Anejo 3<br />
apartado 3.1.). *NRC: Varía consi<strong>de</strong>rablemente <strong>de</strong>pendiendo <strong>de</strong> <strong>la</strong> temperatura ambiente, <strong>de</strong> <strong>la</strong> composición <strong>de</strong> <strong>la</strong> dieta, el ratio <strong>de</strong> crecimiento o <strong>la</strong> producción <strong>de</strong> huevos y tipo <strong>de</strong> equipamiento usado. Los datos presentes se han aplicado bajo temperaturas ambientales <strong>de</strong> 20 a 25º C.*Canada P<strong>la</strong>n Service:<br />
Éstas son <strong>la</strong>s cantida<strong>de</strong>s <strong>de</strong> agua <strong>de</strong> consumo registradas en muchas <strong>de</strong> <strong>la</strong>s literaturas. Sin embargo, investigaciones recientes sugieren que en condiciones <strong>de</strong> elevadas temperaturas, <strong>la</strong>s aves, reducen el consumo <strong>de</strong> alimento y consecuentemente consumen casi <strong>la</strong>s mismas cantida<strong>de</strong>s <strong>de</strong> agua que en<br />
condiciones normales. (A) A Tº normales <strong>de</strong> 20º C (valor medio <strong>de</strong> crecimiento). (B) En caso <strong>de</strong> aves adultas a Tº <strong>de</strong> 20º C. *Leeson & Summers:(A) Indican valores aproximados <strong>de</strong>l uso <strong>de</strong>l agua y variaran según el estado <strong>de</strong> producción, salubridad y consumo <strong>de</strong> alimento.(A) Valores obtenidos a <strong>la</strong>s 4 , 12 y 18<br />
semanas respectivamente.(B)Valores obtenidos con un 50 % y un 80 % <strong>de</strong> producción respectivamente.*Omafra: (A) Resultados <strong>de</strong> <strong>la</strong> gestión y <strong>de</strong>l medio en el que se encuentran los animales. (B) Consumo típico en un año según bases diarias bajo <strong>la</strong>s condiciones agronómicas medias en Ontario.<br />
281