Mélanges de GLMs et nombre de composantes : application ... - Scor
Mélanges de GLMs et nombre de composantes : application ... - Scor
Mélanges de GLMs et nombre de composantes : application ... - Scor

Create successful ePaper yourself
Turn your PDF publications into a flip-book with our unique Google optimized e-Paper software.
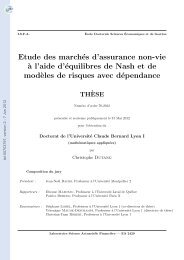
3.3. Extension au portefeuille Vie d’AXA<br />
Figure 3.20 – Modélisation <strong>et</strong> prévision <strong>de</strong>s rachats <strong>de</strong>s produits Structurés par régression<br />
logistique dynamique.<br />
Learning sample (3 months basis),<br />
Structured_products products (All)<br />
Validation sample (3 months basis),<br />
Structured_products products (All)<br />
Observed surr. rate<br />
Mo<strong>de</strong>led surr. rate<br />
95 % confi<strong>de</strong>nce interval<br />
Observed surr. rate<br />
Mo<strong>de</strong>led surr. rate<br />
95 % confi<strong>de</strong>nce interval<br />
surren<strong>de</strong>r rate<br />
0% 0.2% 0.4% 0.6% 0.8% 1% 1.2%<br />
surren<strong>de</strong>r rate<br />
0% 0.2% 0.4% 0.6% 0.8% 1% 1.2%<br />
2004 2005 2006 2007<br />
2008 2009<br />
date<br />
date<br />
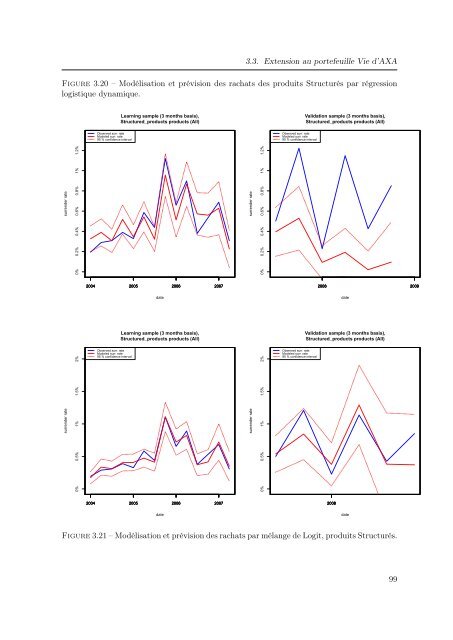
Learning sample (3 months basis),<br />
Structured_products products (All)<br />
Validation sample (3 months basis),<br />
Structured_products products (All)<br />
surren<strong>de</strong>r rate<br />
0% 0.5% 1% 1.5% 2%<br />
Observed surr. rate<br />
Mo<strong>de</strong>led surr. rate<br />
95 % confi<strong>de</strong>nce interval<br />
surren<strong>de</strong>r rate<br />
0% 0.5% 1% 1.5% 2%<br />
Observed surr. rate<br />
Mo<strong>de</strong>led surr. rate<br />
95 % confi<strong>de</strong>nce interval<br />
2004 2005 2006 2007<br />
2008<br />
date<br />
date<br />
Figure 3.21 – Modélisation <strong>et</strong> prévision <strong>de</strong>s rachats par mélange <strong>de</strong> Logit, produits Structurés.<br />
99