Mélanges de GLMs et nombre de composantes : application ... - Scor
Mélanges de GLMs et nombre de composantes : application ... - Scor
Mélanges de GLMs et nombre de composantes : application ... - Scor

You also want an ePaper? Increase the reach of your titles
YUMPU automatically turns print PDFs into web optimized ePapers that Google loves.
Annexe C. Résultats <strong>de</strong>s mélanges <strong>de</strong> Logit<br />
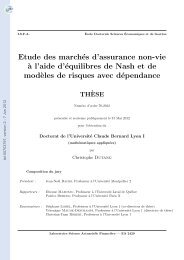
Figure C.15 – Exposition <strong>et</strong> taux <strong>de</strong> rachat trimestriel du portefeuille <strong>de</strong> produits In<strong>de</strong>x-Link.<br />
In<strong>de</strong>x-Link products, All<br />
Surren<strong>de</strong>r rate<br />
Exposure<br />
rates (%)<br />
0.0 0.2 0.4 0.6 0.8 1.0<br />
0 2000 4000 6000 8000<br />
2000 2002 2004 2006<br />
date<br />
rappelle celui constaté sur les produits en UC. Il en est <strong>de</strong> même concernant les taux <strong>de</strong> rachat<br />
globaux par cohorte (c’est pourquoi nous regroupons ici ces <strong>de</strong>ux graphiques). Une forme<br />
erratique, imprévisible, non-monotone. La différence majeure concerne le comportement <strong>de</strong>s<br />
cohortes qui semble davantage lié à l’indice Ibex 35, qui rappelons le s’effondre entre 2000 <strong>et</strong><br />
2002, provoquant un niveau moyen <strong>de</strong> rachat <strong>de</strong>s cohortes supérieur visible sur c<strong>et</strong>te pério<strong>de</strong>.<br />
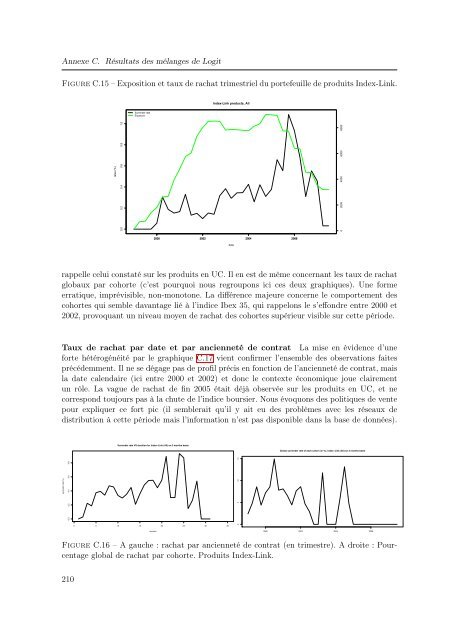
Taux <strong>de</strong> rachat par date <strong>et</strong> par ancienn<strong>et</strong>é <strong>de</strong> contrat La mise en évi<strong>de</strong>nce d’une<br />
forte hétérogénéité par le graphique C.17 vient confirmer l’ensemble <strong>de</strong>s observations faites<br />
précé<strong>de</strong>mment. Il ne se dégage pas <strong>de</strong> profil précis en fonction <strong>de</strong> l’ancienn<strong>et</strong>é <strong>de</strong> contrat, mais<br />
la date calendaire (ici entre 2000 <strong>et</strong> 2002) <strong>et</strong> donc le contexte économique joue clairement<br />
un rôle. La vague <strong>de</strong> rachat <strong>de</strong> fin 2005 était déjà observée sur les produits en UC, <strong>et</strong> ne<br />
correspond toujours pas à la chute <strong>de</strong> l’indice boursier. Nous évoquons <strong>de</strong>s politiques <strong>de</strong> vente<br />
pour expliquer ce fort pic (il semblerait qu’il y ait eu <strong>de</strong>s problèmes avec les réseaux <strong>de</strong><br />
distribution à c<strong>et</strong>te pério<strong>de</strong> mais l’information n’est pas disponible dans la base <strong>de</strong> données).<br />
Surren<strong>de</strong>r rate VS duration for In<strong>de</strong>x−Link (All) on 3 months basis<br />
Global surren<strong>de</strong>r rate of each cohort (in %), In<strong>de</strong>x−Link (All) on 3 months basis<br />
surren<strong>de</strong>r rate (%)<br />
0.0 0.2 0.4 0.6 0.8<br />
0 5 10 15 20 25 30 35<br />
0 5 10 15<br />
duration<br />
2000 2002 2004 2006<br />
Figure C.16 – A gauche : rachat par ancienn<strong>et</strong>é <strong>de</strong> contrat (en trimestre). A droite : Pourcentage<br />
global <strong>de</strong> rachat par cohorte. Produits In<strong>de</strong>x-Link.<br />
210