Mélanges de GLMs et nombre de composantes : application ... - Scor
Mélanges de GLMs et nombre de composantes : application ... - Scor
Mélanges de GLMs et nombre de composantes : application ... - Scor

You also want an ePaper? Increase the reach of your titles
YUMPU automatically turns print PDFs into web optimized ePapers that Google loves.
Annexe C. Résultats <strong>de</strong>s mélanges <strong>de</strong> Logit<br />
"premium.frequency";"gen<strong>de</strong>r";"lapse.age";"un<strong>de</strong>rwriting.age";"un<strong>de</strong>rwritingAge.range";"face.amount";<br />
"unique";"Male";NA;49;"2";9562.04;<br />
"highly.periodic";"Female";NA;32;"1";44560.44;<br />
"highly.periodic";"Male";NA;49;"2";23064.41;<br />
"highly.periodic";"Female";NA;41;"2";36986.28;<br />
"highly.periodic";"Male";26;20;"1";11706.51;<br />
"fa.range";"risk.premium";"riskPrem.range";"saving.premium";"savingPrem.range";"duration";<br />
"high.face.amount";0;"low.risk.premium";601.01;"middle.saving.premium";35.7802197802198;<br />
"high.face.amount";0;"low.risk.premium";490.16;"middle.saving.premium";35.7802197802198;<br />
"high.face.amount";0;"low.risk.premium";1667.22;"high.saving.premium";35.7802197802198;<br />
"high.face.amount";0;"low.risk.premium";1050.42;"high.saving.premium";35.7802197802198;<br />
"high.face.amount";0;"low.risk.premium";336.7;"low.saving.premium";23.4175824175824;<br />
"duration.range";"lapse.reason";"lapse.bit";"surren<strong>de</strong>r.bit"<br />
"high.duration";"In force";"0";"0"<br />
"high.duration";"In force";"0";"0"<br />
"high.duration";"In force";"0";"0"<br />
"high.duration";"In force";"0";"0"<br />
"high.duration";"Surren<strong>de</strong>r";"1";"1"<br />
C.2.2<br />
Analyse <strong>de</strong>scriptive<br />
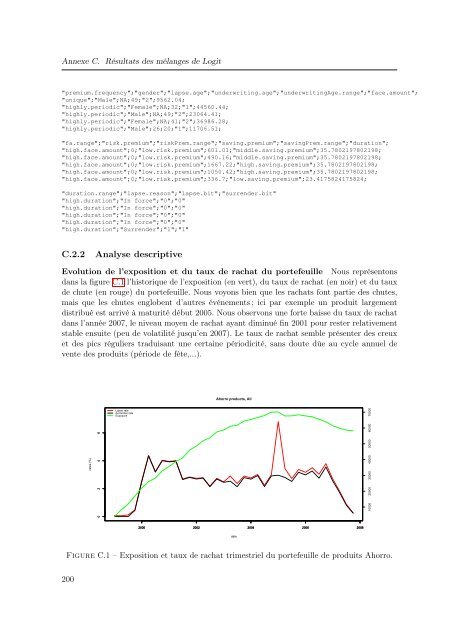
Evolution <strong>de</strong> l’exposition <strong>et</strong> du taux <strong>de</strong> rachat du portefeuille Nous représentons<br />
dans la figure C.1 l’historique <strong>de</strong> l’exposition (en vert), du taux <strong>de</strong> rachat (en noir) <strong>et</strong> du taux<br />
<strong>de</strong> chute (en rouge) du portefeuille. Nous voyons bien que les rachats font partie <strong>de</strong>s chutes,<br />
mais que les chutes englobent d’autres événements ; ici par exemple un produit largement<br />
distribué est arrivé à maturité début 2005. Nous observons une forte baisse du taux <strong>de</strong> rachat<br />
dans l’année 2007, le niveau moyen <strong>de</strong> rachat ayant diminué fin 2001 pour rester relativement<br />
stable ensuite (peu <strong>de</strong> volatilité jusqu’en 2007). Le taux <strong>de</strong> rachat semble présenter <strong>de</strong>s creux<br />
<strong>et</strong> <strong>de</strong>s pics réguliers traduisant une certaine périodicité, sans doute dûe au cycle annuel <strong>de</strong><br />
vente <strong>de</strong>s produits (pério<strong>de</strong> <strong>de</strong> fête,...).<br />
Ahorro products, All<br />
rates (%)<br />
0 2 4 6<br />
Lapse rate<br />
Surren<strong>de</strong>r rate<br />
Exposure<br />
10000 20000 30000 40000 50000 60000 70000<br />
2000 2002 2004 2006 2008<br />
date<br />
Figure C.1 – Exposition <strong>et</strong> taux <strong>de</strong> rachat trimestriel du portefeuille <strong>de</strong> produits Ahorro.<br />
200