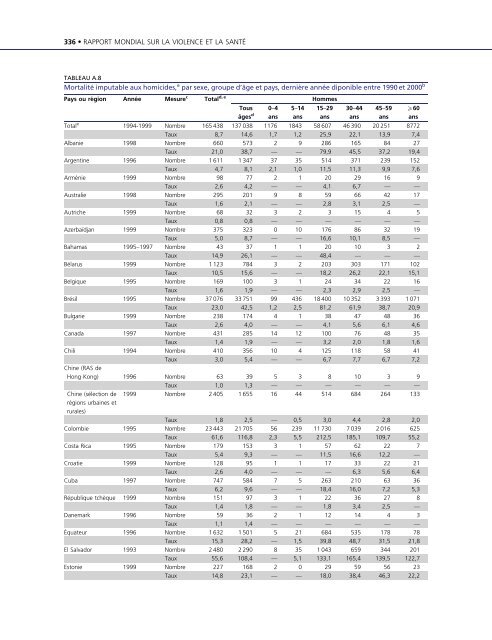
336 . RAPPORT MONDIAL SUR LA VIOLENCE ET LA SANTÉTABLEAU A.8Mortalité imputable aux homicides, a par sexe, groupe d’âge <strong>et</strong> pays, dernière année diponible entre 1990 <strong>et</strong> 2000 bPays ou région Année Me<strong>sur</strong>e c Total d, e HommesTous 0–4 5–14 15–29 30–44 45–59 560âges d ans ans ans ans ans ansTotal e 1994-1999 Nombre 165 438 137 038 1176 1843 58 607 46 390 20 251 8772Taux 8,7 14,6 1,7 1,2 25,9 22,1 13,9 7,4Albanie 1998 Nombre 660 573 2 9 286 165 84 27Taux 21,0 38,7 — — 79,9 45,5 37,2 19,4Argentine 1996 Nombre 1 611 1 347 37 35 514 371 239 152Taux 4,7 8,1 2,1 1,0 11,5 11,3 9,9 7,6Arménie 1999 Nombre 98 77 2 1 20 29 16 9Taux 2,6 4,2 — — 4,1 6,7 — —Australie 1998 Nombre 295 201 9 8 59 66 42 17Taux 1,6 2,1 — — 2,8 3,1 2,5 —Autriche 1999 Nombre 68 32 3 2 3 15 4 5Taux 0,8 0,8 — — — — — —Azerbaïdjan 1999 Nombre 375 323 0 10 176 86 32 19Taux 5,0 8,7 — — 16,6 10,1 8,5 —Bahamas 1995–1997 Nombre 43 37 1 1 20 10 3 2Taux 14,9 26,1 — — 48,4 — — —Bé<strong>la</strong>rus 1999 Nombre 1 123 784 3 2 203 303 171 102Taux 10,5 15,6 — — 18,2 26,2 22,1 15,1Belgique 1995 Nombre 169 100 3 1 24 34 22 16Taux 1,6 1,9 — — 2,3 2,9 2,5 —Brésil 1995 Nombre 37 076 33 751 99 436 18 400 10 352 3 393 1 071Taux 23,0 42,5 1,2 2,5 81,2 61,9 38,7 20,9Bulgarie 1999 Nombre 238 174 4 1 38 47 48 36Taux 2,6 4,0 — — 4,1 5,6 6,1 4,6Canada 1997 Nombre 431 285 14 12 100 76 48 35Taux 1,4 1,9 — — 3,2 2,0 1,8 1,6Chili 1994 Nombre 410 356 10 4 125 118 58 41Taux 3,0 5,4 — — 6,7 7,7 6,7 7,2Chine (RAS deHong Kong) 1996 Nombre 63 39 5 3 8 10 3 9Taux 1,0 1,3 — — — — — —Chine (sélection de 1999 Nombre 2 405 1 655 16 44 514 684 264 133régions urbaines <strong>et</strong>rurales)Taux 1,8 2,5 — 0,5 3,0 4,4 2,8 2,0Colombie 1995 Nombre 23 443 21 705 56 239 11 730 7 039 2 016 625Taux 61,6 116,8 2,3 5,5 212,5 185,1 109,7 55,2Costa Rica 1995 Nombre 179 153 3 1 57 62 22 7Taux 5,4 9,3 — — 11,5 16,6 12,2 —Croatie 1999 Nombre 128 95 1 1 17 33 22 21Taux 2,6 4,0 — — — 6,3 5,6 6,4Cuba 1997 Nombre 747 584 7 5 263 210 63 36Taux 6,2 9,6 — — 18,4 16,0 7,2 5,3République tchèque 1999 Nombre 151 97 3 1 22 36 27 8Taux 1,4 1,8 — — 1,8 3,4 2,5 —Danemark 1996 Nombre 59 36 2 1 12 14 4 3Taux 1,1 1,4 — — — — — —Équateur 1996 Nombre 1 632 1 501 5 21 684 535 178 78Taux 15,3 28,2 — 1,5 39,8 48,7 31,5 21,8El Salvador 1993 Nombre 2 480 2 290 8 35 1 043 659 344 201Taux 55,6 108,4 — 5,1 133,1 165,4 139,5 122,7Estonie 1999 Nombre 227 168 2 0 29 59 56 23Taux 14,8 23,1 — — 18,0 38,4 46,3 22,2
ANNEXE STATISTIQUE . 337Pays ou région Année Me<strong>sur</strong>e c FemmesTous 0–4 5–14 15–29 30–44 45–59 560âges d ans ans ans ans ans ansTotal e 1994-1999 Nombre 28 400 991 1094 7844 8589 4831 5050Taux 8,5 1,5 1,1 8,5 10,8 12,1 16,0Albanie 1998 Nombre 87 4 3 31 30 12 6Taux 5,3 — — 7,2 8,3 — —Argentina 1996 Nombre 264 36 15 86 63 30 35Taux 1,5 2,1 — 2,0 1,9 1,2 1,3Arménie 1999 Nombre 21 0 2 3 6 5 5Taux 1,0 — — — — — —Australie 1998 Nombre 94 10 1 26 26 15 16Taux 1,0 — — 1,3 1,2 — —Autriche 1999 Nombre 36 3 0 4 16 8 5Taux 0,8 — — — — — —Azerbaïdjan 1999 Nombre 52 1 2 12 19 9 9Taux 1,4 — — — — — —Bahamas 1995–1997 Nombre 7 0 1 2 3 1 0Taux — — — — — — —Bé<strong>la</strong>rus 1999 Nombre 339 3 6 60 102 78 90Taux 5,8 — — 5,5 8,6 8,8 7,3Belgique 1995 Nombre 69 3 3 12 24 9 18Taux 1,2 — — — 2,1 — —Brésil 1995 Nombre 3 325 85 183 1 484 1 089 308 177Taux 4,1 1,1 1,1 6,5 6,3 3,3 2,8Bulgarie 1999 Nombre 64 1 1 12 13 15 22Taux 1,3 — — — — — 2,2Canada 1997 Nombre 146 10 10 33 48 25 20Taux 1,0 — — 1,1 1,3 0,9 0,7Chili 1994 Nombre 54 5 3 17 17 5 7Taux 0,8 — — — — — —Chine (RAS deHong Kong) 1996 Nombre 24 4 4 4 9 3 0Taux 0,8 — — — — — —Chine (sélection de 1999 Nombre 750 19 37 218 283 117 76régions urbaines <strong>et</strong>rurales)Taux 1,2 — 0,4 1,4 1,9 1,3 1,0Colombie 1995 Nombre 1 738 33 106 827 511 189 72Taux 9,0 1,4 2,5 15,0 12,6 9,4 5,2Costa Rica 1995 Nombre 26 1 2 15 7 1 0Taux 1,4 — — — — — —Croatie 1999 Nombre 33 1 1 3 7 9 12Taux 1,2 — — — — — —Cuba 1997 Nombre 163 4 4 78 55 13 9Taux 2,7 — — 5,7 4,2 — —République tchèque 1999 Nombre 54 4 2 14 9 13 12Taux 1,0 — — — — — —Danemark 1996 Nombre 23 1 0 7 7 5 3Taux 0,8 — — — — — —Équateur 1996 Nombre 131 5 5 54 40 9 18Taux 2,5 — — 3,2 3,7 — —El Salvador 1993 Nombre 190 3 4 72 56 34 20Taux 8,4 — — 8,8 12,4 12,9 9,8Estonie 1999 Nombre 59 3 1 4 19 21 11Taux 7,4 — — — — 14,4 —
- Page 1 and 2:
Rapportmondial surla violenceet la
- Page 3 and 4:
Rapport mondial surla violence et l
- Page 5 and 6:
Table des matièresAvant-proposPré
- Page 7 and 8:
TABLE DES MATIÈRES . vServices de
- Page 9 and 10:
TABLE DES MATIÈRES . viiGrossesse
- Page 11 and 12:
Avant-proposLe XX ème siècle rest
- Page 13 and 14:
PréfaceLa violence est omniprésen
- Page 15 and 16:
ContributionsConseils en matière d
- Page 17:
CONTRIBUTIONS . xvEncadrés:Ernest
- Page 21 and 22:
IntroductionEn 1996, la Quarante-Ne
- Page 23 and 24:
INTRODUCTION . xxi(suite)(3) de fav
- Page 25:
CHAPITRE 1La violence --- un défip
- Page 28 and 29:
4 . RAPPORT MONDIAL SUR LA VIOLENCE
- Page 30 and 31:
6 . RAPPORT MONDIAL SUR LA VIOLENCE
- Page 32 and 33:
8 . RAPPORT MONDIAL SUR LA VIOLENCE
- Page 34 and 35:
10 . RAPPORT MONDIAL SUR LA VIOLENC
- Page 36 and 37:
12 . RAPPORT MONDIAL SUR LA VIOLENC
- Page 38 and 39:
14 . RAPPORT MONDIAL SUR LA VIOLENC
- Page 40 and 41:
16 . RAPPORT MONDIAL SUR LA VIOLENC
- Page 42 and 43:
18 . RAPPORT MONDIAL SUR LA VIOLENC
- Page 44 and 45:
20 . RAPPORT MONDIAL SUR LA VIOLENC
- Page 46 and 47:
22 . RAPPORT MONDIAL SUR LA VIOLENC
- Page 49:
CHAPITRE 2Les jeunes et la violence
- Page 52 and 53:
28 . RAPPORT MONDIAL SUR LA VIOLENC
- Page 54 and 55:
30 . RAPPORT MONDIAL SUR LA VIOLENC
- Page 56 and 57:
32 . RAPPORT MONDIAL SUR LA VIOLENC
- Page 58 and 59:
34 . RAPPORT MONDIAL SUR LA VIOLENC
- Page 60 and 61:
36 . RAPPORT MONDIAL SUR LA VIOLENC
- Page 62 and 63:
38 . RAPPORT MONDIAL SUR LA VIOLENC
- Page 64 and 65:
40 . RAPPORT MONDIAL SUR LA VIOLENC
- Page 66 and 67:
42 . RAPPORT MONDIAL SUR LA VIOLENC
- Page 68 and 69:
44 . RAPPORT MONDIAL SUR LA VIOLENC
- Page 70 and 71:
46 . RAPPORT MONDIAL SUR LA VIOLENC
- Page 72 and 73:
48 . RAPPORT MONDIAL SUR LA VIOLENC
- Page 74 and 75:
50 . RAPPORT MONDIAL SUR LA VIOLENC
- Page 76 and 77:
52 . RAPPORT MONDIAL SUR LA VIOLENC
- Page 78 and 79:
54 . RAPPORT MONDIAL SUR LA VIOLENC
- Page 80 and 81:
56 . RAPPORT MONDIAL SUR LA VIOLENC
- Page 82 and 83:
58 . RAPPORT MONDIAL SUR LA VIOLENC
- Page 84 and 85:
60 . RAPPORT MONDIAL SUR LA VIOLENC
- Page 87:
CHAPITRE 3La maltraitance des enfan
- Page 90 and 91:
66 . RAPPORT MONDIAL SUR LA VIOLENC
- Page 92 and 93:
68 . RAPPORT MONDIAL SUR LA VIOLENC
- Page 94 and 95:
70 . RAPPORT MONDIAL SUR LA VIOLENC
- Page 96 and 97:
72 . RAPPORT MONDIAL SUR LA VIOLENC
- Page 98 and 99:
74 . RAPPORT MONDIAL SUR LA VIOLENC
- Page 100 and 101:
76 . RAPPORT MONDIAL SUR LA VIOLENC
- Page 102 and 103:
78 . RAPPORT MONDIAL SUR LA VIOLENC
- Page 104 and 105:
80 . RAPPORT MONDIAL SUR LA VIOLENC
- Page 106 and 107:
82 . RAPPORT MONDIAL SUR LA VIOLENC
- Page 108 and 109:
84 . RAPPORT MONDIAL SUR LA VIOLENC
- Page 110 and 111:
86 . RAPPORT MONDIAL SUR LA VIOLENC
- Page 112 and 113:
88 . RAPPORT MONDIAL SUR LA VIOLENC
- Page 114 and 115:
90 . RAPPORT MONDIAL SUR LA VIOLENC
- Page 116 and 117:
92 . RAPPORT MONDIAL SUR LA VIOLENC
- Page 118 and 119:
94 . RAPPORT MONDIAL SUR LA VIOLENC
- Page 121:
CHAPITRE 4La violence exercéepar d
- Page 124 and 125:
100 . RAPPORT MONDIAL SUR LA VIOLEN
- Page 126 and 127:
102 . RAPPORT MONDIAL SUR LA VIOLEN
- Page 128 and 129:
104 . RAPPORT MONDIAL SUR LA VIOLEN
- Page 130 and 131:
106 . RAPPORT MONDIAL SUR LA VIOLEN
- Page 132 and 133:
108 . RAPPORT MONDIAL SUR LA VIOLEN
- Page 134 and 135:
110 . RAPPORT MONDIAL SUR LA VIOLEN
- Page 136 and 137:
112 . RAPPORT MONDIAL SUR LA VIOLEN
- Page 138 and 139:
114 . RAPPORT MONDIAL SUR LA VIOLEN
- Page 140 and 141:
116 . RAPPORT MONDIAL SUR LA VIOLEN
- Page 142 and 143:
118 . RAPPORT MONDIAL SUR LA VIOLEN
- Page 144 and 145:
120 . RAPPORT MONDIAL SUR LA VIOLEN
- Page 146 and 147:
122 . RAPPORT MONDIAL SUR LA VIOLEN
- Page 148 and 149:
124 . RAPPORT MONDIAL SUR LA VIOLEN
- Page 150 and 151:
126 . RAPPORT MONDIAL SUR LA VIOLEN
- Page 152 and 153:
128 . RAPPORT MONDIAL SUR LA VIOLEN
- Page 154 and 155:
130 . RAPPORT MONDIAL SUR LA VIOLEN
- Page 156 and 157:
132 . RAPPORT MONDIAL SUR LA VIOLEN
- Page 158 and 159:
134 . RAPPORT MONDIAL SUR LA VIOLEN
- Page 161:
CHAPITRE 5La maltraitance desperson
- Page 164 and 165:
140 . RAPPORT MONDIAL SUR LA VIOLEN
- Page 166 and 167:
142 . RAPPORT MONDIAL SUR LA VIOLEN
- Page 168 and 169:
144 . RAPPORT MONDIAL SUR LA VIOLEN
- Page 170 and 171:
146 . RAPPORT MONDIAL SUR LA VIOLEN
- Page 172 and 173:
148 . RAPPORT MONDIAL SUR LA VIOLEN
- Page 174 and 175:
150 . RAPPORT MONDIAL SUR LA VIOLEN
- Page 176 and 177:
152 . RAPPORT MONDIAL SUR LA VIOLEN
- Page 178 and 179:
154 . RAPPORT MONDIAL SUR LA VIOLEN
- Page 180 and 181:
156 . RAPPORT MONDIAL SUR LA VIOLEN
- Page 182 and 183:
158 . RAPPORT MONDIAL SUR LA VIOLEN
- Page 184 and 185:
160 . RAPPORT MONDIAL SUR LA VIOLEN
- Page 186 and 187:
162 . RAPPORT MONDIAL SUR LA VIOLEN
- Page 189 and 190:
CHAPITRE 6. LA VIOLENCE SEXUELLE .
- Page 191 and 192:
CHAPITRE 6. LA VIOLENCE SEXUELLE .
- Page 193 and 194:
CHAPITRE 6. LA VIOLENCE SEXUELLE .
- Page 195 and 196:
CHAPITRE 6. LA VIOLENCE SEXUELLE .
- Page 197 and 198:
CHAPITRE 6. LA VIOLENCE SEXUELLE .
- Page 199:
CHAPITRE 6. LA VIOLENCE SEXUELLE .
- Page 202 and 203:
178 . RAPPORT MONDIAL SUR LA VIOLEN
- Page 204 and 205:
180 . RAPPORT MONDIAL SUR LA VIOLEN
- Page 206 and 207:
182 . RAPPORT MONDIAL SUR LA VIOLEN
- Page 208 and 209:
184 . RAPPORT MONDIAL SUR LA VIOLEN
- Page 210 and 211:
186 . RAPPORT MONDIAL SUR LA VIOLEN
- Page 212 and 213:
188 . RAPPORT MONDIAL SUR LA VIOLEN
- Page 214 and 215:
190 . RAPPORT MONDIAL SUR LA VIOLEN
- Page 216 and 217:
192 . RAPPORT MONDIAL SUR LA VIOLEN
- Page 218 and 219:
194 . RAPPORT MONDIAL SUR LA VIOLEN
- Page 220 and 221:
196 . RAPPORT MONDIAL SUR LA VIOLEN
- Page 222 and 223:
198 . RAPPORT MONDIAL SUR LA VIOLEN
- Page 224 and 225:
200 . RAPPORT MONDIAL SUR LA VIOLEN
- Page 227:
CHAPITRE 7La violence dirigéecontr
- Page 230 and 231:
206 . RAPPORT MONDIAL SUR LA VIOLEN
- Page 232 and 233:
208 . RAPPORT MONDIAL SUR LA VIOLEN
- Page 234 and 235:
210 . RAPPORT MONDIAL SUR LA VIOLEN
- Page 236 and 237:
212 . RAPPORT MONDIAL SUR LA VIOLEN
- Page 238 and 239:
214 . RAPPORT MONDIAL SUR LA VIOLEN
- Page 240 and 241:
216 . RAPPORT MONDIAL SUR LA VIOLEN
- Page 242 and 243:
218 . RAPPORT MONDIAL SUR LA VIOLEN
- Page 244 and 245:
220 . RAPPORT MONDIAL SUR LA VIOLEN
- Page 246 and 247:
222 . RAPPORT MONDIAL SUR LA VIOLEN
- Page 248 and 249:
224 . RAPPORT MONDIAL SUR LA VIOLEN
- Page 250 and 251:
226 . RAPPORT MONDIAL SUR LA VIOLEN
- Page 252 and 253:
228 . RAPPORT MONDIAL SUR LA VIOLEN
- Page 254 and 255:
230 . RAPPORT MONDIAL SUR LA VIOLEN
- Page 256 and 257:
232 . RAPPORT MONDIAL SUR LA VIOLEN
- Page 258 and 259:
234 . RAPPORT MONDIAL SUR LA VIOLEN
- Page 261:
CHAPITRE 8La violence collective
- Page 264 and 265:
240 . RAPPORT MONDIAL SUR LA VIOLEN
- Page 266 and 267:
242 . RAPPORT MONDIAL SUR LA VIOLEN
- Page 268 and 269:
244 . RAPPORT MONDIAL SUR LA VIOLEN
- Page 270 and 271:
246 . RAPPORT MONDIAL SUR LA VIOLEN
- Page 272 and 273:
248 . RAPPORT MONDIAL SUR LA VIOLEN
- Page 274 and 275:
250 . RAPPORT MONDIAL SUR LA VIOLEN
- Page 276 and 277:
252 . RAPPORT MONDIAL SUR LA VIOLEN
- Page 278 and 279:
254 . RAPPORT MONDIAL SUR LA VIOLEN
- Page 280 and 281:
256 . RAPPORT MONDIAL SUR LA VIOLEN
- Page 282 and 283:
258 . RAPPORT MONDIAL SUR LA VIOLEN
- Page 284 and 285:
260 . RAPPORT MONDIAL SUR LA VIOLEN
- Page 286 and 287:
262 . RAPPORT MONDIAL SUR LA VIOLEN
- Page 288 and 289:
264 . RAPPORT MONDIAL SUR LA VIOLEN
- Page 290 and 291:
266 . RAPPORT MONDIAL SUR LA VIOLEN
- Page 293 and 294:
CHAPITRE 9. RECOMMANDATIONS SUR LES
- Page 295 and 296:
CHAPITRE 9. RECOMMANDATIONS SUR LES
- Page 297 and 298:
CHAPITRE 9. RECOMMANDATIONS SUR LES
- Page 299 and 300:
CHAPITRE 9. RECOMMANDATIONS SUR LES
- Page 301 and 302:
CHAPITRE 9. RECOMMANDATIONS SUR LES
- Page 303 and 304:
CHAPITRE 9. RECOMMANDATIONS SUR LES
- Page 305 and 306:
CHAPITRE 9. RECOMMANDATIONS SUR LES
- Page 307:
Annexe statistique
- Page 310 and 311: 286 . RAPPORT MONDIAL SUR LA VIOLEN
- Page 312: 288 . RAPPORT MONDIAL SUR LA VIOLEN
- Page 315 and 316: ANNEXE STATISTIQUE . 291Etats Membr
- Page 317 and 318: ANNEXE STATISTIQUE . 293Etats Membr
- Page 319 and 320: ANNEXE STATISTIQUE . 295Etats Membr
- Page 321 and 322: ANNEXE STATISTIQUE . 297Etats Membr
- Page 323 and 324: ANNEXE STATISTIQUE . 299Nombres abs
- Page 325 and 326: ANNEXE STATISTIQUE . 301Proportion
- Page 327 and 328: ANNEXE STATISTIQUE . 303Nombres abs
- Page 329 and 330: ANNEXE STATISTIQUE . 305Proportion
- Page 331 and 332: ANNEXE STATISTIQUE . 307Nombres abs
- Page 333 and 334: ANNEXE STATISTIQUE . 309Proportion
- Page 335 and 336: ANNEXE STATISTIQUE . 311Nombres abs
- Page 337 and 338: ANNEXE STATISTIQUE . 313Proportion
- Page 339 and 340: ANNEXE STATISTIQUE . 315TABLEAU A.6
- Page 341 and 342: ANNEXE STATISTIQUE . 317TABLEAU A.6
- Page 343 and 344: ANNEXE STATISTIQUE . 319TABLEAU A.6
- Page 345 and 346: ANNEXE STATISTIQUE . 321TABLEAU A.6
- Page 347 and 348: ANNEXE STATISTIQUE . 323TABLEAU A.6
- Page 349 and 350: ANNEXE STATISTIQUE . 325TABLEAU A.6
- Page 351 and 352: ANNEXE STATISTIQUE . 327TABLEAU A.6
- Page 353 and 354: ANNEXE STATISTIQUE . 329Pays ou ré
- Page 355 and 356: ANNEXE STATISTIQUE . 331Pays ou ré
- Page 357 and 358: ANNEXE STATISTIQUE . 333Pays ou ré
- Page 359: ANNEXE STATISTIQUE . 335Pays ou ré
- Page 363 and 364: ANNEXE STATISTIQUE . 339Pays ou ré
- Page 365 and 366: ANNEXE STATISTIQUE . 341Pays ou ré
- Page 368 and 369: 344 . RAPPORT MONDIAL SUR LA VIOLEN
- Page 370 and 371: 346 . RAPPORT MONDIAL SUR LA VIOLEN
- Page 372 and 373: 348 . RAPPORT MONDIAL SUR LA VIOLEN
- Page 374 and 375: 350 . RAPPORT MONDIAL SUR LA VIOLEN
- Page 376 and 377: 352 . RAPPORT MONDIAL SUR LA VIOLEN
- Page 379 and 380: RéférencesOn trouvera ci-dessous
- Page 381 and 382: RÉFÉRENCES . 357TABLEAU 1 (suite)
- Page 383: RÉFÉRENCES . 359Le Département P
- Page 386 and 387: 362 . RAPPORT MONDIAL SUR LA VIOLEN
- Page 388 and 389: 364 . RAPPORT MONDIAL SUR LA VIOLEN
- Page 390 and 391: 366 . RAPPORT MONDIAL SUR LA VIOLEN
- Page 392 and 393: 368 . RAPPORT MONDIAL SUR LA VIOLEN
- Page 394 and 395: 370 . RAPPORT MONDIAL SUR LA VIOLEN
- Page 396 and 397: 372 . RAPPORT MONDIAL SUR LA VIOLEN
- Page 398 and 399: 374 . RAPPORT MONDIAL SUR LA VIOLEN
- Page 400: 376 . RAPPORT MONDIAL SUR LA VIOLEN
- Page 404: La violence écourte la vie de mill