Manual - 8500A Series Peak Power Meter - Giga-tronics
Manual - 8500A Series Peak Power Meter - Giga-tronics
Manual - 8500A Series Peak Power Meter - Giga-tronics

Create successful ePaper yourself
Turn your PDF publications into a flip-book with our unique Google optimized e-Paper software.
<strong>Series</strong> <strong>8500A</strong> <strong>Peak</strong> <strong>Power</strong> <strong>Meter</strong>s<br />
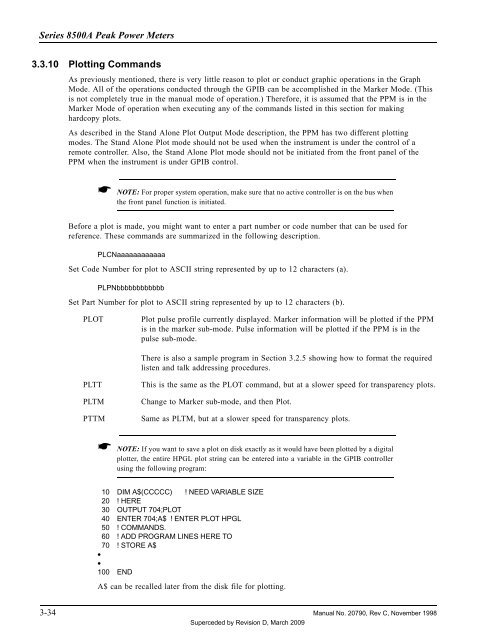
3.3.10 Plotting Commands<br />
As previously mentioned, there is very little reason to plot or conduct graphic operations in the Graph<br />
Mode. All of the operations conducted through the GPIB can be accomplished in the Marker Mode. (This<br />
is not completely true in the manual mode of operation.) Therefore, it is assumed that the PPM is in the<br />
Marker Mode of operation when executing any of the commands listed in this section for making<br />
hardcopy plots.<br />
As described in the Stand Alone Plot Output Mode description, the PPM has two different plotting<br />
modes. The Stand Alone Plot mode should not be used when the instrument is under the control of a<br />
remote controller. Also, the Stand Alone Plot mode should not be initiated from the front panel of the<br />
PPM when the instrument is under GPIB control.<br />
☛ NOTE: For proper system operation, make sure that no active controller is on the bus when<br />
the front panel function is initiated.<br />
Before a plot is made, you might want to enter a part number or code number that can be used for<br />
reference. These commands are summarized in the following description.<br />
PLCNaaaaaaaaaaaa<br />
Set Code Number for plot to ASCII string represented by up to 12 characters (a).<br />
PLPNbbbbbbbbbbbb<br />
Set Part Number for plot to ASCII string represented by up to 12 characters (b).<br />
PLOT<br />
Plot pulse profile currently displayed. Marker information will be plotted if the PPM<br />
is in the marker sub-mode. Pulse information will be plotted if the PPM is in the<br />
pulse sub-mode.<br />
There is also a sample program in Section 3.2.5 showing how to format the required<br />
listen and talk addressing procedures.<br />
PLTT<br />
PLTM<br />
PTTM<br />
This is the same as the PLOT command, but at a slower speed for transparency plots.<br />
Change to Marker sub-mode, and then Plot.<br />
Same as PLTM, but at a slower speed for transparency plots.<br />
☛ NOTE: If you want to save a plot on disk exactly as it would have been plotted by a digital<br />
plotter, the entire HPGL plot string can be entered into a variable in the GPIB controller<br />
using the following program:<br />
10 DIM A$(CCCCC) ! NEED VARIABLE SIZE<br />
20 ! HERE<br />
30 OUTPUT 704;PLOT<br />
40 ENTER 704;A$ ! ENTER PLOT HPGL<br />
50 ! COMMANDS.<br />
60 ! ADD PROGRAM LINES HERE TO<br />
70 ! STORE A$<br />
•<br />
•<br />
100 END<br />
A$ can be recalled later from the disk file for plotting.<br />
3-34 <strong>Manual</strong> No. 20790, Rev C, November 1998<br />
Superceded by Revision D, March 2009