Manual - 8500A Series Peak Power Meter - Giga-tronics
Manual - 8500A Series Peak Power Meter - Giga-tronics
Manual - 8500A Series Peak Power Meter - Giga-tronics

You also want an ePaper? Increase the reach of your titles
YUMPU automatically turns print PDFs into web optimized ePapers that Google loves.
Operation<br />
2.8.6 <strong>Peak</strong> <strong>Power</strong> Measurements Using the Graph Mode<br />
It is recommended that you read the basic information pertaining to the Graph Mode in Section 2.6.3 for<br />
a better understanding of this function. The initial Graph Mode (Cursor sub-mode) display looks<br />
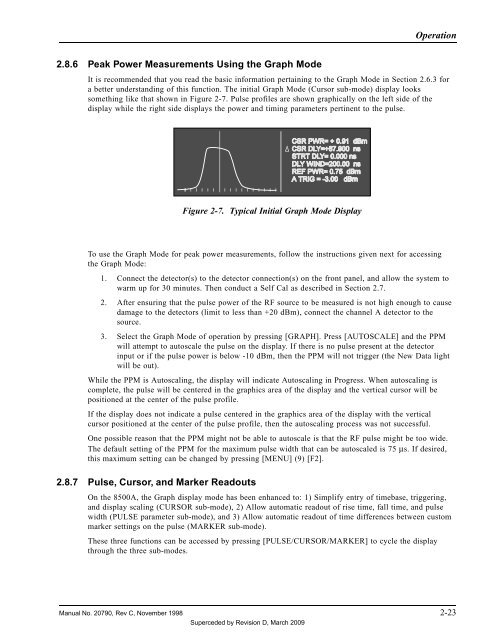
something like that shown in Figure 2-7. Pulse profiles are shown graphically on the left side of the<br />
display while the right side displays the power and timing parameters pertinent to the pulse.<br />
Figure 2-7. Typical Initial Graph Mode Display<br />
To use the Graph Mode for peak power measurements, follow the instructions given next for accessing<br />
the Graph Mode:<br />
1. Connect the detector(s) to the detector connection(s) on the front panel, and allow the system to<br />
warm up for 30 minutes. Then conduct a Self Cal as described in Section 2.7.<br />
2. After ensuring that the pulse power of the RF source to be measured is not high enough to cause<br />
damage to the detectors (limit to less than +20 dBm), connect the channel A detector to the<br />
source.<br />
3. Select the Graph Mode of operation by pressing [GRAPH]. Press [AUTOSCALE] and the PPM<br />
will attempt to autoscale the pulse on the display. If there is no pulse present at the detector<br />
input or if the pulse power is below -10 dBm, then the PPM will not trigger (the New Data light<br />
will be out).<br />
While the PPM is Autoscaling, the display will indicate Autoscaling in Progress. When autoscaling is<br />
complete, the pulse will be centered in the graphics area of the display and the vertical cursor will be<br />
positioned at the center of the pulse profile.<br />
If the display does not indicate a pulse centered in the graphics area of the display with the vertical<br />
cursor positioned at the center of the pulse profile, then the autoscaling process was not successful.<br />
One possible reason that the PPM might not be able to autoscale is that the RF pulse might be too wide.<br />
The default setting of the PPM for the maximum pulse width that can be autoscaled is 75 µs. If desired,<br />
this maximum setting can be changed by pressing [MENU] (9) [F2].<br />
2.8.7 Pulse, Cursor, and Marker Readouts<br />
On the <strong>8500A</strong>, the Graph display mode has been enhanced to: 1) Simplify entry of timebase, triggering,<br />
and display scaling (CURSOR sub-mode), 2) Allow automatic readout of rise time, fall time, and pulse<br />
width (PULSE parameter sub-mode), and 3) Allow automatic readout of time differences between custom<br />
marker settings on the pulse (MARKER sub-mode).<br />
These three functions can be accessed by pressing [PULSE/CURSOR/MARKER] to cycle the display<br />
through the three sub-modes.<br />
<strong>Manual</strong> No. 20790, Rev C, November 1998 2-23<br />
Superceded by Revision D, March 2009