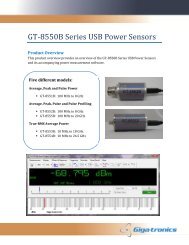
Manual - 8500A Series Peak Power Meter - Giga-tronics
Manual - 8500A Series Peak Power Meter - Giga-tronics
Manual - 8500A Series Peak Power Meter - Giga-tronics

Create successful ePaper yourself
Turn your PDF publications into a flip-book with our unique Google optimized e-Paper software.
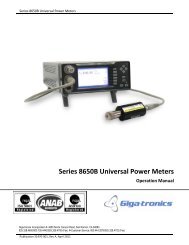
<strong>Series</strong> <strong>8500A</strong> <strong>Peak</strong> <strong>Power</strong> <strong>Meter</strong>s<br />
Plot Output Mode<br />
In this mode the PPM sends HPGL plotter commands to plot a pulse on a compatible plotter. The PPM<br />
command PLOT initiates the capturing of a pulse and relevant information that will be plotted when the<br />
PPM enters TACS. The procedure to plot a graph over the GPIB consists of the following steps:<br />
1. Prepare the PPM by entering the Graph Mode and obtaining the desired pulse profile to be<br />
plotted as shown in the PPM’s display window. Also select which sub-mode you want because<br />
the data shown on the plot is different for each sub-mode. For example, selecting the Marker<br />
sub-mode will cause the marker values to be shown at the bottom of the plot.<br />
2. Send the PLOT command to the PPM.<br />
3. Listen-address the plotter.<br />
4. Talk-address the PPM.<br />
5. Release ATN, putting the PPM in TACS.<br />
The PPM will terminate the plot with a carriage return followed by a line feed sent with EOI. If<br />
necessary, the plot can be aborted by the untalking of the PPM during transmission of the plot.<br />
Whenever the PLOT command is sent to the PPM while it is in the Graph Mode, the PPM will plot a<br />
graph of the selected Cursor, Pulse, or Marker sub-mode. See Figures 2-8, 2-10 and 2-9 for typical plots<br />
of Graph sub-mode pulse profiles.<br />
The following commands are used when it is desired to have any serial or code numbers appear on a<br />
hardcopy plot.<br />
PLPNxxxxxx......<br />
(x = string of 12 or less characters<br />
Plot part number, ASCII string)<br />
PLCNxxxxxx......<br />
(x = string of 12 or less characters<br />
Plot code number, ASCII string)<br />
Any printable character is allowed, including spaces, except that all leading spaces prior to the first<br />
non-space character are stripped off, and not included in the number of characters in the string. The<br />
string must be terminated by a semicolon which is not printed. Therefore, no semicolons can be<br />
contained within a label string.<br />
Sample Program:<br />
10 ! THIS PROGRAM DEMONSTRATES<br />
20 ! HOW TO MAKE THE PPM OUTPUT<br />
30 ! A PULSE PROFILE DISPLAYED<br />
40 ! IN THE GRAPH MODE TO A<br />
50 ! DIGITAL PLOTTER.<br />
60 !<br />
70 ! C$ AND P$ ARE STRINGS<br />
80 ! THAT CAN BE SENT SO THAT A<br />
90 ! CODE NUMBER & PART NUMBER<br />
100 ! ARE PRINTED ON THE PLOT BY<br />
110 ! THE PPM.<br />
120 !<br />
130 C$=ABCDEFGHIJKL<br />
140 P$=123456789012<br />
150<br />
160 ! AFTER ENTRY INTO THE GRAPH<br />
170 ! MODE, THE FOLLOWING<br />
3-8 <strong>Manual</strong> No. 20790, Rev C, November 1998<br />
Superceded by Revision D, March 2009