Manual - 8500A Series Peak Power Meter - Giga-tronics
Manual - 8500A Series Peak Power Meter - Giga-tronics
Manual - 8500A Series Peak Power Meter - Giga-tronics

Create successful ePaper yourself
Turn your PDF publications into a flip-book with our unique Google optimized e-Paper software.
Operation<br />
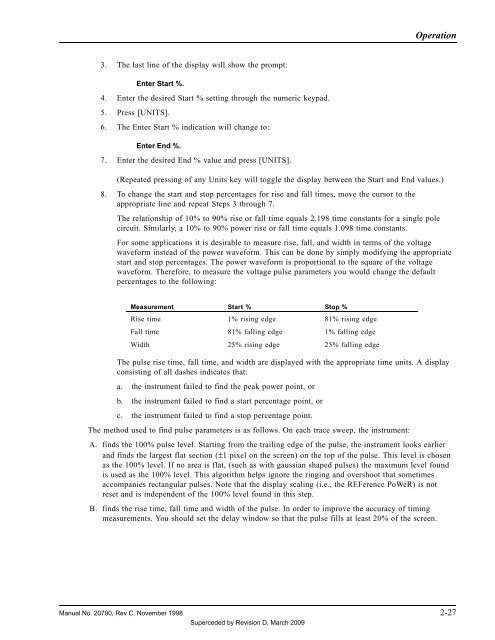
3. The last line of the display will show the prompt:<br />
Enter Start %.<br />
4. Enter the desired Start % setting through the numeric keypad.<br />
5. Press [UNITS].<br />
6. The Enter Start % indication will change to:<br />
Enter End %.<br />
7. Enter the desired End % value and press [UNITS].<br />
(Repeated pressing of any Units key will toggle the display between the Start and End values.)<br />
8. To change the start and stop percentages for rise and fall times, move the cursor to the<br />
appropriate line and repeat Steps 3 through 7.<br />
The relationship of 10% to 90% rise or fall time equals 2.198 time constants for a single pole<br />
circuit. Similarly, a 10% to 90% power rise or fall time equals 1.098 time constants.<br />
For some applications it is desirable to measure rise, fall, and width in terms of the voltage<br />
waveform instead of the power waveform. This can be done by simply modifying the appropriate<br />
start and stop percentages. The power waveform is proportional to the square of the voltage<br />
waveform. Therefore, to measure the voltage pulse parameters you would change the default<br />
percentages to the following:<br />
Measurement Start % Stop %<br />
Rise time 1% rising edge 81% rising edge<br />
Fall time 81% falling edge 1% falling edge<br />
Width 25% rising edge 25% falling edge<br />
The pulse rise time, fall time, and width are displayed with the appropriate time units. A display<br />
consisting of all dashes indicates that:<br />
a. the instrument failed to find the peak power point, or<br />
b. the instrument failed to find a start percentage point, or<br />
c. the instrument failed to find a stop percentage point.<br />
The method used to find pulse parameters is as follows. On each trace sweep, the instrument:<br />
A. finds the 100% pulse level. Starting from the trailing edge of the pulse, the instrument looks earlier<br />
and finds the largest flat section (±1 pixel on the screen) on the top of the pulse. This level is chosen<br />
as the 100% level. If no area is flat, (such as with gaussian shaped pulses) the maximum level found<br />
is used as the 100% level. This algorithm helps ignore the ringing and overshoot that sometimes<br />
accompanies rectangular pulses. Note that the display scaling (i.e., the REFerence PoWeR) is not<br />
reset and is independent of the 100% level found in this step.<br />
B. finds the rise time, fall time and width of the pulse. In order to improve the accuracy of timing<br />
measurements. You should set the delay window so that the pulse fills at least 20% of the screen.<br />
<strong>Manual</strong> No. 20790, Rev C, November 1998 2-27<br />
Superceded by Revision D, March 2009