Manual - 8500A Series Peak Power Meter - Giga-tronics
Manual - 8500A Series Peak Power Meter - Giga-tronics
Manual - 8500A Series Peak Power Meter - Giga-tronics

You also want an ePaper? Increase the reach of your titles
YUMPU automatically turns print PDFs into web optimized ePapers that Google loves.
<strong>Series</strong> <strong>8500A</strong> <strong>Peak</strong> <strong>Power</strong> <strong>Meter</strong>s<br />
2.8.10 Marker Sub-Mode Functions<br />
The Marker sub-mode is another completely independent way to read the time difference between user<br />
defined points on the pulse waveform. It may, at first, seem redundant with the Pulse parameter mode.<br />
The Marker sub-mode, however, treats the 100% power point differently, and reads the differences<br />
between four user-defined points on the waveform. It is intended for use in specialized applications (such<br />
as measuring the linearity of the leading edge skirt of a navigation pulse) where the user is interested in<br />
something other than standard rise, fall, and width measurements. This Marker sub-mode is also most<br />
similar to the Marker Mode offered in the original 8500 <strong>Peak</strong> <strong>Power</strong> <strong>Meter</strong>.<br />
The Marker sub-mode uses the user-set REFerence PoWeR as the 100% power point of the pulse. This<br />
allows the user to set the 100% point at other than the flat spot at the top of the pulse. For instance, the<br />
100% point can be set at the top of the pulse overshoot. The 100% point can also be set 10 dB lower than<br />
the top of the pulse to scale all the user-set marker percentages by 1/10. This is particularly useful to set<br />
marker percentages to resolutions better than 0.1% of the peak power.<br />
The default settings for marker sub-mode are set for the measurement of linearity on the leading edge of<br />
a navigation pulse. In this particular measurement, the time between the 5%, 13.3%, 21.7%, and 30%<br />
points on the voltage waveform are compared. Equal times indicate a linear voltage waveform between<br />
the 5% and 30% point on the waveform. Because markers are entered in terms of % power, the<br />
corresponding power percentages would be 0.25%, 1.78%, 4.69%, and 9.00%. Because markers can only<br />
be entered to 0.1% resolution, the actual marker values are set 10 times greater or 2.5%, 17.8%, 46.9%<br />
and 90.0%. Then, to get the maximum resolution from the markers the REFerence PoWeR is set to<br />
exactly 10 dB less than the peak power of the pulse, effectively scaling all marker values by 1/10. (This<br />
action must be done manually.)<br />
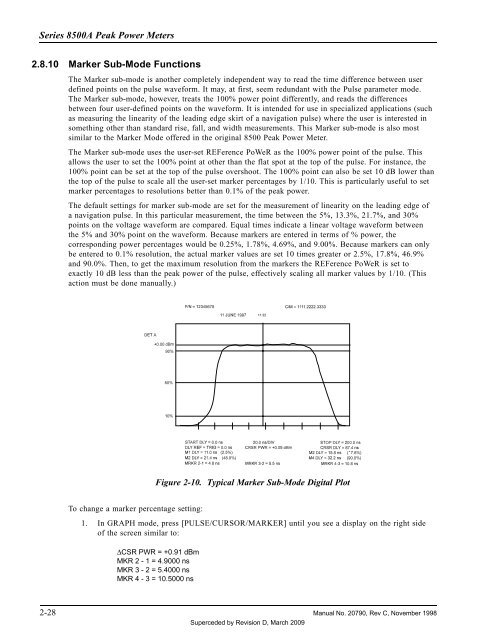
Figure 2-10. Typical Marker Sub-Mode Digital Plot<br />
To change a marker percentage setting:<br />
1. In GRAPH mode, press [PULSE/CURSOR/MARKER] until you see a display on the right side<br />
of the screen similar to:<br />
∆CSR PWR = +0.91 dBm<br />
MKR 2 - 1 = 4.9000 ns<br />
MKR 3 - 2 = 5.4000 ns<br />
MKR 4 - 3 = 10.5000 ns<br />
2-28 <strong>Manual</strong> No. 20790, Rev C, November 1998<br />
Superceded by Revision D, March 2009