cHAPITre cINQ 160 5.1N Géographie sociale <strong>de</strong> L’urbanisation 0 1,500 3,000 Kms Concentration et Regroupement Géographique Pour les besoins <strong>de</strong> l’élaboration du présent rapport, il a été retenu que la sous-région <strong>de</strong> l’Afrique Centrale se compose <strong>de</strong> l’Angola, du Cameroun, <strong>de</strong> la République Centrafricaine (RCA), du Congo, du Gabon, <strong>de</strong> la Guinée Equatoriale, <strong>de</strong> la République Démocratique du Congo, <strong>de</strong> São Tomé e Príncipe et du Tchad. La superficie totale <strong>de</strong> la sous-région est <strong>de</strong> 5,366 millions <strong>de</strong> km 2 , correspondant à 17,7 pour cent <strong>de</strong> la superficie <strong>de</strong> l’ensemble du continent africain. La population <strong>de</strong> la sous-région <strong>de</strong> l’Afrique centrale, selon les estimations, se chiffrait, en 2010, à 128.909.000 d’âmes dont 55.592.000 (ou 43.1pour cent) résidant dans <strong>de</strong>s zones classées comme urbaines. Avec un taux <strong>de</strong> 23,98 pour cent <strong>de</strong> citadins, la région <strong>de</strong>meure la zone la moins urbanisée du continent après l’Afrique orientale. Il revient toutefois <strong>de</strong> noter que l’Afrique centrale est en train <strong>de</strong> rattraper les autres sous-régions les plus urbanisées du continent. Depuis la décennie 1980 – 1990, lorsque les populations urbaines ont connu un taux <strong>de</strong> croissance annuelle <strong>de</strong> l’ordre <strong>de</strong> 3,65 pour cent, l’on a noté, dans l’intervalle décennal, <strong>de</strong>s augmentations N constantes du taux d’urbanisation : 4.6 pour cent entre 1990 et 2000 ; 5,9 pour cent% entre 2000 et 2010 ; et <strong>de</strong>s projections <strong>de</strong> 6,48 pour cent entre 2010 et 2020 et 6,63 pour cent entre 2020 0 1,500 3,000 Kms Southern African Countries et 2030. A partir <strong>de</strong> 2030, les augmentations <strong>de</strong>s taux décennaux d’urbanisation commenceront à baisser : <strong>de</strong> 6,23 pour cent entre 2030 et 2040 et 5,98 pour cent entre 2040 et 2050. Cette tendance CARTE 5.1: les Pays <strong>de</strong> l’aFriQue centrale Central African Countries N 0 1,500 3,000 Kms N 0 1,500 3,000 Kms Western African Countries déclinante est à localiser autour <strong>de</strong> 2022 et après l’urbanisation <strong>de</strong> la majeure partie <strong>de</strong> la population <strong>de</strong> la sous-région. Ces taux d’urbanisation élevés indiquent que la population urbaine <strong>de</strong> l’Afrique centrale a plus que doublé, partant <strong>de</strong> 23.741.000 personnes en 1990 à 55.593.000 en 2010. Les projections démographiques autorisent d’affirmer que la population urbaine franchira la barre <strong>de</strong> 100.000.000 rési<strong>de</strong>nts en 2022, atteindra le chiffre <strong>de</strong> 112,7 millions d’ici 2030 et 185,9 millions d’ici 2050. La croissance démographique en milieu urbain est appelée, en dépit du ralentissement <strong>de</strong> son rythme, à se maintenir jusqu’en 2030 ou (très probablement) même au <strong>de</strong>là <strong>de</strong> cette échéance (voir tableau 5.1). Après une augmentation <strong>de</strong> 19,1 pour cent <strong>de</strong> citadins que l’on observera au courant <strong>de</strong> la décennie 2000 – 2010, <strong>de</strong>s taux <strong>de</strong> croissance plus faibles <strong>de</strong> la population urbaine, en dépit <strong>de</strong> l’expansion régulière <strong>de</strong> cette <strong>de</strong>rnière ajouteront aux centres urbains 25,9 millions <strong>de</strong> citadins durant la décennie 2010 - 2020 et 31,2 million entre 2020 et 2030. Avec un taux <strong>de</strong> 86 pour cent, le Gabon, en 2010, comptait le plus grand nombre <strong>de</strong> populations résidant en milieu urbain, et N était la nation la plus urbanisée <strong>de</strong> la région, suivie <strong>de</strong> loin par São Tomé e Príncipe (62,2 pour cent) et le Congo (62,1 pour cent). Les pays les moins urbanisés étaient les suivants : le Tchad (27,63 0 1,500 3,000 Kms pour cent), la République Démocratique du Congo (35,22 pour cent) et la Guinée Equatoriale (39,7 pour cent). Tous les pays cités affichaient un taux d’urbanisation inférieur à la moyenne <strong>de</strong> 39,9 pour cent <strong>de</strong> l’ensemble du continent africain. Durant la décennie 2010 – 2020, l’Angola et le Cameroun étaient en tête <strong>de</strong>s pays <strong>de</strong> l’Afrique Centrale à urbanisation rapi<strong>de</strong> avec <strong>de</strong>s taux <strong>de</strong> croissance respectifs <strong>de</strong> 9,5 pour cent et 8,5 pour cent. Et tous les <strong>de</strong>ux sont <strong>de</strong>venus <strong>de</strong>s nations à prédominance urbaine, juste avant 2005 ; à compter <strong>de</strong> 2010, leurs taux respectifs d’urbanisation avaient, selon les estimations, augmenté <strong>de</strong> 58,5 pour cent et 58,4 pour cent. L’on prévoit que d’ici 2020, les taux d’urbanisation <strong>de</strong>s <strong>de</strong>ux pays seront légèrement inférieurs aux <strong>de</strong>ux tiers <strong>de</strong> leurs populations totales, et que d’ici 2040, plus <strong>de</strong> 75 pour cent <strong>de</strong>s populations <strong>de</strong>sdits pays seront <strong>de</strong>s citadins. A l’extrémité inférieure <strong>de</strong> l’évolution <strong>de</strong> l’urbanisation, les prévisions indiquent que jusqu’après 2030, la Guinée Equatoriale, la République Démocratique (RDC) du Congo et la République Centrafricaine (RCA) ne feront pas encore partie <strong>de</strong>s pays à prédominance urbaine et que ce ne sera qu’autour <strong>de</strong> 2042 que le Tchad pourra y prétendre. D’ici cette échéance l’Afrique centrale, dans son ensemble, comptera plus <strong>de</strong> populations urbaines que rurales. Au courant <strong>de</strong> la décennie 2010 – 2020, toutefois, le taux <strong>de</strong> croissance <strong>de</strong> l’intervalle décennal <strong>de</strong>s populations urbaines <strong>de</strong> l’Afrique centrale est susceptible d’être plus élevé au Tchad (22,8 pour cent) qu’en Angola (12, 1pour cent), au Cameroun (12,1 pour cent), et au Gabon (3,1pour centk6), le taux le plus faible, ce qui autorise <strong>de</strong> se prononcer sur une convergence <strong>de</strong>s tendances <strong>de</strong>s taux d’urbanisation au fil du temps.
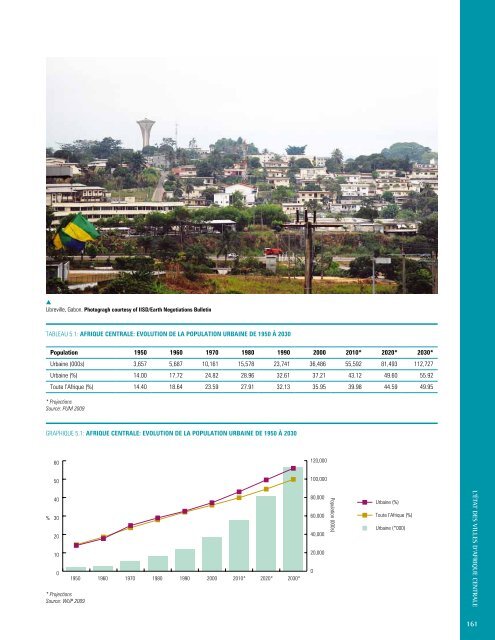
s Libreville, Gabon. Photogragh courtesy of iisd/earth negotiations bulletin TABLEAU 5.1: aFriQue centrale: evolution <strong>de</strong> la PoPulation urbaine <strong>de</strong> 1950 à 2030 Population 1950 1960 1970 1980 1990 2000 2010* 2020* 2030* Urbaine (000s) 3,657 5,687 10,161 15,578 23,741 36,486 55,592 81,493 112,727 Urbaine (%) 14.00 17.72 24.82 28.96 32.61 37.21 43.12 49.60 55.92 Toute l’Afrique (%) 14.40 18.64 23.59 27.91 32.13 35.95 39.98 44.59 49.95 * Projections Source: PUM 2009 GRAPHIQUE 5.1: aFriQue centrale: evolution <strong>de</strong> la PoPulation urbaine <strong>de</strong> 1950 à 2030 % 60 50 40 30 20 10 0 1950 * Projections Source: WUP 2009 1960 1970 1980 1990 2000 2010* 2020* 2030* 120,000 100,000 80,000 60,000 40,000 20,000 0 Population (000s) Urbaine (%) Toute l’Afrique (%) Urbaine (*000) L’éTAT <strong>de</strong>s <strong>VILLes</strong> d’AFrIQUe ceNTrALe 161
- Page 1 and 2:
L’état des Villes Africaines 201
- Page 3 and 4:
L’état des Villes Africaines 201
- Page 5 and 6:
Préface du PNUe Un urbanisme défa
- Page 7 and 8:
Table des Matières Préface d’ON
- Page 10 and 11:
INTrOdUcTION x Introduction Ce rapp
- Page 12 and 13:
ésUMé 2 Les nouvelles configurati
- Page 14 and 15:
cHAPITre PreMIer Chapitre Premier 0
- Page 16 and 17:
cHAPITre PreMIer 6 1.1 Géographie
- Page 18 and 19:
cHAPITre PreMIer 8 Les problèmes d
- Page 20 and 21:
cHAPITre PreMIer 10 d’une manièr
- Page 22 and 23:
cHAPITre PreMIer 12 Le changement c
- Page 24 and 25:
cHAPITre PreMIer 14 ENCAdRé 1.2: l
- Page 26 and 27:
cHAPITre PreMIer 16 s Addis-Abéba,
- Page 28 and 29:
cHAPITre PreMIer 18 1.3 Gouvernemen
- Page 30 and 31:
cHAPITre PreMIer 20 ce type de gouv
- Page 32 and 33:
cHAPITre PreMIer 22 ENCAdRé 1.3: o
- Page 34 and 35:
cHAPITre PreMIer 24 s Site d'évacu
- Page 36 and 37:
cHAPITre PreMIer 26 ENCAdRé 1.6: v
- Page 38 and 39:
cHAPITre PreMIer 28 les conséquenc
- Page 40 and 41:
cHAPITre PreMIer 30 s Kibera, à Na
- Page 42 and 43:
cHAPITre PreMIer 32 1.5 Les Finance
- Page 44 and 45:
cHAPITre PreMIer 34 GRAPHIQUE 1.5:
- Page 46 and 47:
cHAPITre PreMIer 36 ENCAdRé 1.8: F
- Page 48 and 49:
cHAPITre PreMIer 38 domaines, déto
- Page 50 and 51:
cHAPITre PreMIer 40 1.7 Les Plus Gr
- Page 52 and 53:
cHAPITre PreMIer 42 TABLEAU 1.7: le
- Page 54 and 55:
cHAPITre PreMIer 44 ENCAdRé 1.9: P
- Page 56 and 57:
Chapitre Deux 02 cHAPITre deUx 46 s
- Page 58 and 59:
cHAPITre deUx 48 2.1 L’expansion
- Page 60 and 61:
cHAPITre deUx 50 CARTE 2.2: PoPulat
- Page 62 and 63:
cHAPITre deUx 52 TABLEAU 2.5: indic
- Page 64 and 65:
cHAPITre deUx 54 Les Liens Entre Pa
- Page 66 and 67:
cHAPITre deUx 56 inversée, le coef
- Page 68 and 69:
cHAPITre deUx 58 TABLEAU 2.8: cHôM
- Page 70 and 71:
cHAPITre deUx 60 ENCAdRé 2.1: le P
- Page 72 and 73:
cHAPITre deUx 62 d’accès aux ser
- Page 74 and 75:
cHAPITre deUx 64 s Casablanca, Maro
- Page 76 and 77:
cHAPITre deUx 66 de Tunis, Fès, Me
- Page 78 and 79:
cHAPITre deUx 68 s Le Caire, Egypte
- Page 80 and 81:
cHAPITre deUx 70 s Hammamet, Tunisi
- Page 82 and 83:
cHAPITre deUx 72 TABLEAU 2.9: Eau d
- Page 84 and 85:
cHAPITre deUx 74 très vulnérable
- Page 86 and 87:
cHAPITre deUx 76 CARTE 2.3: trajECt
- Page 88 and 89:
cHAPITre deUx 78 • La culture. L
- Page 90 and 91:
cHAPITre deUx 80 CARTE 2.4: la stra
- Page 92 and 93:
cHAPITre deUx 82 entité administra
- Page 94 and 95:
Chapitre trois 03 cHAPITre TrOIs 84
- Page 96 and 97:
cHAPITre TrOIs 86 3.1 La Géographi
- Page 98 and 99:
cHAPITre TrOIs 88 TABLEAU 3.2: aFri
- Page 100 and 101:
cHAPITre TrOIs 90 des richesses, de
- Page 102 and 103:
cHAPITre TrOIs 92 CARTE 3.4: distri
- Page 104 and 105:
cHAPITre TrOIs 94 s dakar, Sénéga
- Page 106 and 107:
cHAPITre TrOIs 96 Les Liens Entre P
- Page 108 and 109:
cHAPITre TrOIs 98 3.2 La Géographi
- Page 110 and 111:
cHAPITre TrOIs 100 La proportion de
- Page 112 and 113:
cHAPITre TrOIs 102 s Accra, Ghana.
- Page 114 and 115:
cHAPITre TrOIs 104 FIGURE 3.2: cat
- Page 116 and 117:
cHAPITre TrOIs 106 supplémentaire.
- Page 118 and 119:
cHAPITre TrOIs 108 nopole de l’Et
- Page 120 and 121: cHAPITre TrOIs 110 à aménager, y
- Page 122 and 123: cHAPITre TrOIs 112 s Bidonvilles de
- Page 124 and 125: cHAPITre TrOIs 114 3.4 La Géograph
- Page 126 and 127: cHAPITre TrOIs 116 Le changement cl
- Page 128 and 129: cHAPITre TrOIs 118 s dakar, Sénég
- Page 130 and 131: cHAPITre TrOIs 120 CARTE 3.10: dist
- Page 132 and 133: cHAPITre QUATre cHAPITre QUATre Cha
- Page 134 and 135: cHAPITre QUATre 124 4.1 Géographie
- Page 136 and 137: cHAPITre QUATre 126 TABLEAU 4.2: aF
- Page 138 and 139: cHAPITre QUATre 128 ENCAdRé 4.1: l
- Page 140 and 141: cHAPITre QUATre 130 4.2 La Géograp
- Page 142 and 143: cHAPITre QUATre 132 Faire Face à L
- Page 144 and 145: cHAPITre QUATre 134 ENCAdRé 4.4: M
- Page 146 and 147: cHAPITre QUATre 136 de ces marchés
- Page 148 and 149: cHAPITre QUATre 138 du Rwanda. Les
- Page 150 and 151: cHAPITre QUATre 140 s Elèves dans
- Page 152 and 153: cHAPITre QUATre 142 plus, en l’ab
- Page 154 and 155: cHAPITre QUATre 144 s Kampala, Ouga
- Page 156 and 157: cHAPITre QUATre 146 du marché fonc
- Page 158 and 159: cHAPITre QUATre 148 4.4 La Géograp
- Page 160 and 161: cHAPITre QUATre 150 s Logements à
- Page 162 and 163: cHAPITre QUATre 152 ENCAdRé 4.8: u
- Page 164 and 165: cHAPITre QUATre 154 4.5 Les Nouveau
- Page 166 and 167: cHAPITre QUATre 156 carte 4.7: la r
- Page 168 and 169: cHAPITre cINQ Chapitre Cinq 05 158
- Page 172 and 173: cHAPITre cINQ 162 TABLEAU 5.2: evol
- Page 174 and 175: cHAPITre cINQ 164 TABLEAU 5.5: donn
- Page 176 and 177: cHAPITre cINQ 166 s Un nouveau quar
- Page 178 and 179: cHAPITre cINQ 168 5.2 Géographie
- Page 180 and 181: cHAPITre cINQ 170 TABLEAU 5.9: tauX
- Page 182 and 183: cHAPITre cINQ 172 5.3 Géographie U
- Page 184 and 185: cHAPITre cINQ 174 des droits coutum
- Page 186 and 187: cHAPITre cINQ 176 terrains et de la
- Page 188 and 189: cHAPITre cINQ 178 s Construction d
- Page 190 and 191: cHAPITre cINQ 180 Economie Politiqu
- Page 192 and 193: cHAPITre cINQ 182 et qui échappent
- Page 194 and 195: cHAPITre cINQ 184 5.5 Questions ém
- Page 196 and 197: cHAPITre cINQ 186 s Luanda, Angola.
- Page 198 and 199: cHAPITre cINQ 188 report. De nouvel
- Page 200 and 201: cHAPITre sIx Chapitre Six 06 190 s
- Page 202 and 203: cHAPITre sIx 192 6.1 La Géographie
- Page 204 and 205: cHAPITre sIx 194 On se penche ici s
- Page 206 and 207: cHAPITre sIx 196 s Lusaka, Zambie.
- Page 208 and 209: cHAPITre sIx 198 s Enfants des rues
- Page 210 and 211: cHAPITre sIx 200 épuisé, le racco
- Page 212 and 213: cHAPITre sIx 202 6.2 La Géographie
- Page 214 and 215: cHAPITre sIx 204 s Quartier informe
- Page 216 and 217: cHAPITre sIx 206 6.3 La Géographie
- Page 218 and 219: cHAPITre sIx 208 GRAPHIQUE 6.8: dé
- Page 220 and 221:
cHAPITre sIx 210 GRAPHIQUE 6.9: les
- Page 222 and 223:
cHAPITre sIx 212 Comment Fonctionne
- Page 224 and 225:
cHAPITre sIx 214 Slag Piles Diepklo
- Page 226 and 227:
cHAPITre sIx 216 mauvaise sécurit
- Page 228 and 229:
cHAPITre sIx 218 ENCAdRé 6.5: un r
- Page 230 and 231:
cHAPITre sIx 220 6.5 Nouveaux Probl
- Page 232 and 233:
cHAPITre sIx 222 s Le Stade Moses M
- Page 234 and 235:
cHAPITre sIx 224 Après l’avènem
- Page 236 and 237:
ANNexe sTATIsTIQUe 226 Annexe stati
- Page 238 and 239:
ANNexe sTATIsTIQUe 228 Population t
- Page 240 and 241:
ANNexe sTATIsTIQUe 230 TABLEAU 2: P
- Page 242 and 243:
ANNexe sTATIsTIQUe 232 TABLEAU 3: P
- Page 244 and 245:
ANNexe sTATIsTIQUe 234 Population d
- Page 246 and 247:
ANNexe sTATIsTIQUe 236 TABLEAU 4: P
- Page 248 and 249:
ANNexe sTATIsTIQUe 238 Pays ville a
- Page 250 and 251:
ANNexe sTATIsTIQUe 240 Pays ville a
- Page 252 and 253:
ANNexe sTATIsTIQUe 242 Pays ville a
- Page 254 and 255:
ANNexe sTATIsTIQUe 244 Pays ville a
- Page 256 and 257:
ANNexe sTATIsTIQUe 246 Pays année
- Page 258 and 259:
ANNexe sTATIsTIQUe 248 TABLEAU 7: c
- Page 260 and 261:
ANNexe sTATIsTIQUe 250 année zone
- Page 262 and 263:
ANNexe sTATIsTIQUe 252 TABLEAU 11:
- Page 264 and 265:
ANNexe sTATIsTIQUe 254 TABLEAU 12:
- Page 266:
ANNexe sTATIsTIQUe 256 TABLEAU 13: